1.5. SciPy:高级科学计算
作者:Gaël Varoquaux,Adrien Chauve,Andre Espaze,Emmanuelle Gouillart,Ralf Gommers
提示
scipy 可以与其他标准的科学计算库进行比较,例如 GSL(用于 C 和 C++ 的 GNU 科学库)或 Matlab 的工具箱。scipy 是 Python 中科学例程的核心包;它旨在对 numpy 数组进行高效操作,因此 NumPy 和 SciPy 可以协同工作。
在实现例程之前,值得检查所需的數據處理是否已在 SciPy 中实现。作为非专业程序员,科学家往往倾向于 **重新发明轮子**,这会导致代码出现错误、效率低下、难以共享和难以维护。相比之下,SciPy 的例程经过优化和测试,因此应尽可能使用它们。
警告
本教程远非数值计算的入门教程。由于枚举 SciPy 中的不同子模块和函数会非常枯燥,因此我们专注于几个示例,以大致了解如何使用 scipy 进行科学计算。
scipy 由特定于任务的子模块组成
矢量量化/K均值 |
|
物理和数学常数 |
|
傅里叶变换 |
|
积分例程 |
|
插值 |
|
数据输入和输出 |
|
线性代数例程 |
|
n 维图像包 |
|
正交距离回归 |
|
优化 |
|
信号处理 |
|
稀疏矩阵 |
|
空间数据结构和算法 |
|
任何特殊数学函数 |
|
统计 |
1.5.1. 文件输入/输出:scipy.io
scipy.io 包含用于加载和保存几种常见格式(包括 Matlab、IDL、Matrix Market 和 Harwell-Boeing)中数据的函数。
**Matlab 文件**:加载和保存
>>> import scipy as sp
>>> a = np.ones((3, 3))
>>> sp.io.savemat('file.mat', {'a': a})  # savemat expects a dictionary
>>> data = sp.io.loadmat('file.mat')
>>> data['a']
array([[1.,  1.,  1.],
       [1.,  1.,  1.],
       [1.,  1.,  1.]])
警告
**Python/Matlab 不匹配**:Matlab 文件格式不支持一维数组。
>>> a = np.ones(3)
>>> a
array([1.,  1.,  1.])
>>> a.shape
(3,)
>>> sp.io.savemat('file.mat', {'a': a})
>>> a2 = sp.io.loadmat('file.mat')['a']
>>> a2
array([[1.,  1.,  1.]])
>>> a2.shape
(1, 3)
请注意,原始数组是一维数组,而保存和重新加载的数组是具有单行的二维数组。
有关其他格式,请参阅 scipy.io 文档。
另请参阅
加载文本文件:
numpy.loadtxt()/numpy.savetxt()文本/csv 文件的智能加载:
numpy.genfromtxt()快速高效,但特定于 NumPy 的二进制格式:
numpy.save()/numpy.load()Matplotlib 中图像的基本输入/输出:
matplotlib.pyplot.imread()/matplotlib.pyplot.imsave()更高级的图像输入/输出:
imageio
1.5.2. 特殊函数:scipy.special
“特殊”函数是在科学和数学中常用的函数,不被认为是“基本”函数。示例包括
伽马函数,
scipy.special.gamma(),误差函数,
scipy.special.erf(),贝塞尔函数,例如
scipy.special.jv()(第一类贝塞尔函数),以及椭圆函数,例如
scipy.special.ellipj()(雅可比椭圆函数)。
其他特殊函数是熟悉的基本函数的组合,但它们提供的精度或鲁棒性比其简单的实现要好。
这些函数中的大多数都是逐元素计算的,并且当输入数组具有不同形状时,遵循标准的 NumPy 广播规则。例如,scipy.special.xlog1py() 在数学上等价于  。
。
>>> import scipy as sp
>>> x = np.asarray([1, 2])
>>> y = np.asarray([[3], [4], [5]])
>>> res = sp.special.xlog1py(x, y)
>>> res.shape
(3, 2)
>>> ref = x * np.log(1 + y)
>>> np.allclose(res, ref)
True
然而,对于较小的 ,
,scipy.special.xlog1py()在数值上更有优势,因为显式地加1会导致由于浮点数截断误差而损失精度。
>>> x = 2.5
>>> y = 1e-18
>>> x * np.log(1 + y)
np.float64(0.0)
>>> sp.special.xlog1py(x, y)
np.float64(2.5e-18)
许多特殊函数也有“对数化”的变体。例如,伽马函数 与阶乘函数的关系为
 ,但它将定义域从正整数扩展到复平面。
>>> x = np.arange(10)
>>> np.allclose(sp.special.gamma(x + 1), sp.special.factorial(x))
True
>>> sp.special.gamma(5) < sp.special.gamma(5.5) < sp.special.gamma(6)
np.True_
阶乘函数增长很快,因此对于中等大小的参数,伽马函数会溢出。但是,有时只需要伽马函数的对数。在这种情况下,我们可以使用scipy.special.gammaln()直接计算伽马函数的对数。
>>> x = [5, 50, 500]
>>> np.log(sp.special.gamma(x))
array([  3.17805383, 144.56574395,          inf])
>>> sp.special.gammaln(x)
array([   3.17805383,  144.56574395, 2605.11585036])
当计算的中间部分会溢出或下溢,但最终结果不会溢出或下溢时,通常可以使用此类函数。例如,假设我们希望计算比率 。
。
>>> a = sp.special.gamma(500)
>>> b = sp.special.gamma(499)
>>> a, b
(np.float64(inf), np.float64(inf))
分子和分母都会溢出,因此执行 不会返回我们想要的结果。但是,结果的量级应该适中,因此想到了使用对数。结合恒等式
 和
和 ,我们得到
,我们得到
>>> log_a = sp.special.gammaln(500)
>>> log_b = sp.special.gammaln(499)
>>> log_res = log_a - log_b
>>> res = np.exp(log_res)
>>> res
np.float64(499.0000000...)
类似地,假设我们希望计算差值 。为此,我们使用
scipy.special.logsumexp(),它使用一个避免溢出的数值技巧计算 。
。
>>> res = sp.special.logsumexp([log_a, log_b],
...                            b=[1, -1])  # weights the terms of the sum
>>> res
np.float64(2605.113844343...)
有关这些以及许多其他特殊函数的更多信息,请参阅scipy.special的文档。
1.5.3. 线性代数运算: scipy.linalg
scipy.linalg为标准线性代数运算提供了高效的编译实现的 Python 接口:BLAS(基本线性代数子程序)和 LAPACK(线性代数包)库。
例如,scipy.linalg.det()函数计算方阵的行列式
>>> import scipy as sp
>>> arr = np.array([[1, 2],
...                 [3, 4]])
>>> sp.linalg.det(arr)
np.float64(-2.0)
在数学上,线性系统 的解为
的解为 ,但是矩阵的显式求逆在数值上不稳定,应该避免。相反,使用
scipy.linalg.solve()
>>> A = np.array([[1, 2],
...               [2, 3]])
>>> b = np.array([14, 23])
>>> x = sp.linalg.solve(A, b)
>>> x
array([4., 5.])
>>> np.allclose(A @ x, b)
True
具有特殊结构的线性系统通常比更一般的系统更有效地求解。例如,具有三角矩阵的系统可以使用scipy.linalg.solve_triangular()求解
>>> A_upper = np.triu(A)
>>> A_upper
array([[1, 2],
       [0, 3]])
>>> np.allclose(sp.linalg.solve_triangular(A_upper, b, lower=False),
...             sp.linalg.solve(A_upper, b))
True
scipy.linalg还具有矩阵分解/分解,例如奇异值分解。
>>> A = np.array([[1, 2],
...               [2, 3]])
>>> U, s, Vh = sp.linalg.svd(A)
>>> s  # singular values
array([4.23606798, 0.23606798])
可以通过矩阵乘法恢复原始矩阵
>>> S = np.diag(s)  # convert to diagonal matrix before matrix multiplication
>>> A2 = U @ S @ Vh
>>> np.allclose(A2, A)
True
>>> A3 = (U * s) @ Vh  # more efficient: use array math broadcasting rules!
>>> np.allclose(A3, A)
True
许多其他分解(例如 LU、Cholesky、QR)、结构化线性系统的求解器(例如三角形、循环矩阵)、特征值问题算法、矩阵函数(例如矩阵指数)以及特殊矩阵创建例程(例如块对角线、托普利茨)都可以在scipy.linalg中找到。
1.5.4. 插值: scipy.interpolate
scipy.interpolate用于将函数(“插值函数”)拟合到实验数据或计算数据。拟合完成后,插值函数可用于逼近中间点的底层函数;它还可用于计算函数的积分、导数或反函数。
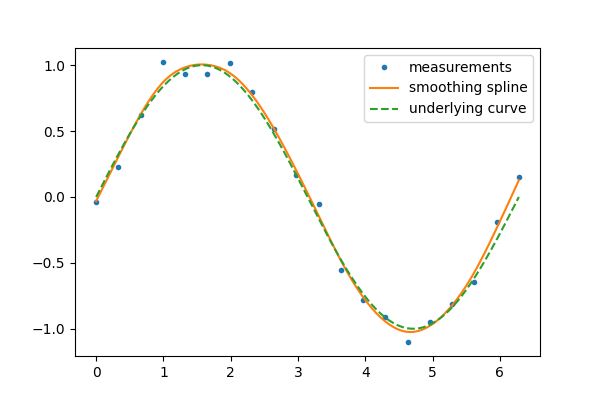
某些类型的插值函数,称为“平滑样条”,旨在从噪声数据生成平滑曲线。例如,假设我们有以下数据
>>> rng = np.random.default_rng(27446968)
>>> measured_time = np.linspace(0, 2*np.pi, 20)
>>> function = np.sin(measured_time)
>>> noise = rng.normal(loc=0, scale=0.1, size=20)
>>> measurements = function + noise
scipy.interpolate.make_smoothing_spline()可用于形成类似于底层正弦函数的曲线。
>>> smoothing_spline = sp.interpolate.make_smoothing_spline(measured_time, measurements)
>>> interpolation_time = np.linspace(0, 2*np.pi, 200)
>>> smooth_results = smoothing_spline(interpolation_time)
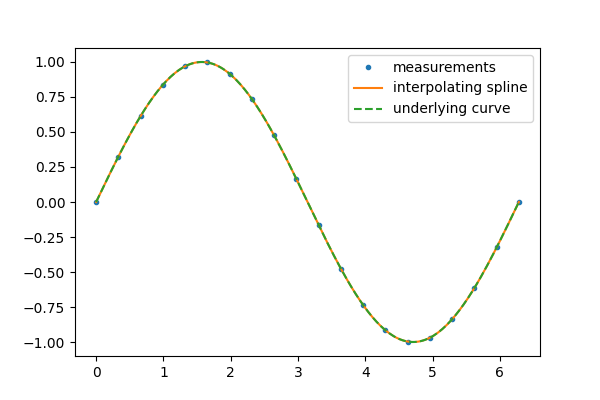
另一方面,如果数据没有噪声,则可能希望精确地通过每个点。
>>> interp_spline = sp.interpolate.make_interp_spline(measured_time, function)
>>> interp_results = interp_spline(interpolation_time)
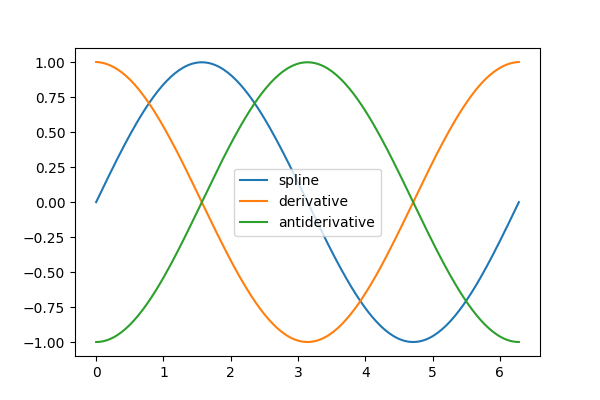
结果对象的derivative和antiderivative方法可用于微分和积分。对于后者,积分常数假定为零,但我们可以“包装”反导数以包含非零积分常数。
>>> d_interp_spline = interp_spline.derivative()
>>> d_interp_results = d_interp_spline(interpolation_time)
>>> i_interp_spline = lambda t: interp_spline.antiderivative()(t) - 1
>>> i_interp_results = i_interp_spline(interpolation_time)
对于在某个区间上单调的函数(例如,从 到
到 的
的 ),我们可以反转
make_interp_spline的参数以插值反函数。因为第一个参数预计是单调递增的,所以我们还使用numpy.flip()反转数组中元素的顺序。
>>> i = (measured_time > np.pi/2) & (measured_time < 3*np.pi/2)
>>> inverse_spline = sp.interpolate.make_interp_spline(np.flip(function[i]),
...                                                    np.flip(measured_time[i]))
>>> inverse_spline(0)
array(3.14159265)
有关更高级的样条插值示例,请参阅Sprogø 站的最大风速预测上的总结练习,并阅读SciPy 插值教程和scipy.interpolate文档以获取更多信息。
1.5.5. 优化和拟合: scipy.optimize
scipy.optimize提供了用于求根、曲线拟合和更一般优化的算法。
1.5.5.1. 求根
scipy.optimize.root_scalar()尝试查找指定标量值函数的根(即函数值为零的参数)。与许多scipy.optimize函数一样,该函数需要对解进行初始猜测,算法将对其进行细化,直到收敛或识别失败。我们还提供导数来提高收敛速度。
>>> def f(x):
...     return (x-1)*(x-2)
>>> def df(x):
...     return 2*x - 3
>>> x0 = 0  # guess
>>> res = sp.optimize.root_scalar(f, x0=x0, fprime=df)
>>> res
      converged: True
           flag: converged
 function_calls: 12
     iterations: 6
           root: 1.0
         method: newton
警告
接受猜测的scipy.optimize中的任何函数都不能保证对所有可能的猜测都收敛!(例如,在上面的示例中尝试x0=1.5,其中函数的导数恰好为零。)如果发生这种情况,请尝试不同的猜测,调整选项(例如提供如下所示的bracket),或考虑 SciPy 是否为问题提供了更合适的方法。
请注意,只找到了1.0处的根。通过检查,我们可以看出在2.0处还有另一个根。我们可以通过更改猜测或传递仅包含我们寻找的根的括号来将函数引导到特定的根。
>>> res = sp.optimize.root_scalar(f, bracket=(1.5, 10))
>>> res.root
2.0
对于多元问题,请使用scipy.optimize.root()。
>>> def f(x):
...     # intersection of unit circle and line from origin
...     return [x[0]**2 + x[1]**2 - 1,
...             x[1] - x[0]]
>>> res = sp.optimize.root(f, x0=[0, 0])
>>> np.allclose(f(res.x), 0, atol=1e-10)
True
>>> np.allclose(res.x, np.sqrt(2)/2)
True
可以使用 scipy.optimize.root() 且设置 method='lm'(Levenberg-Marquardt)方法,以最小二乘法的意义解决超定问题。
>>> def f(x):
...     # intersection of unit circle, line from origin, and parabola
...     return [x[0]**2 + x[1]**2 - 1,
...             x[1] - x[0],
...             x[1] - x[0]**2]
>>> res = sp.optimize.root(f, x0=[1, 1], method='lm')
>>> res.success
True
>>> res.x
array([0.76096066, 0.66017736])
请参阅 scipy.optimize.root_scalar() 和 scipy.optimize.root() 的文档,了解各种其他求解算法和选项。
1.5.5.2. 曲线拟合
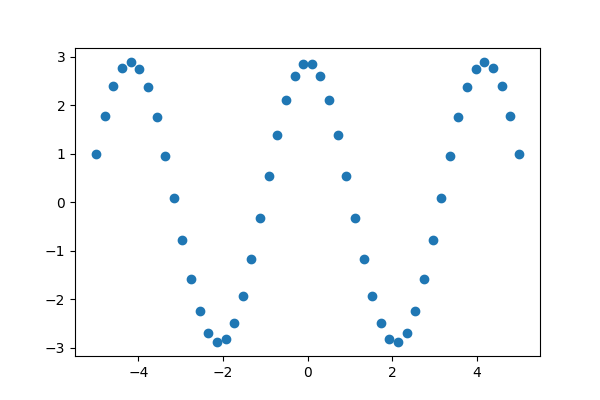
假设我们有一些正弦但带有噪声的数据。
>>> x = np.linspace(-5, 5, num=50)  # 50 values between -5 and 5
>>> noise = 0.01 * np.cos(100 * x)
>>> a, b = 2.9, 1.5
>>> y = a * np.cos(b * x) + noise
我们可以通过最小二乘曲线拟合来近似数据中潜在的幅度、频率和相位。首先,我们编写一个函数,该函数以自变量作为第一个参数,并将所有要拟合的参数作为单独的参数。
>>> def f(x, a, b, c):
...     return a * np.sin(b * x + c)
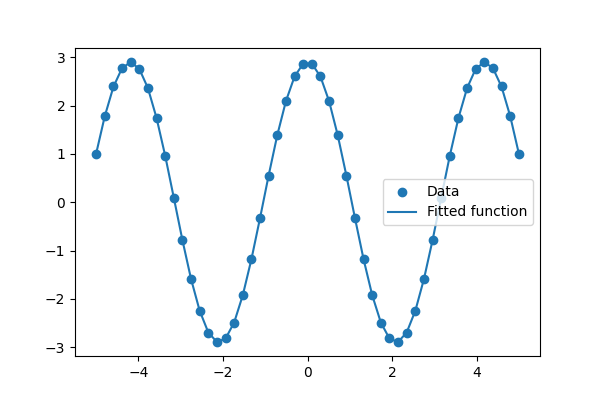
然后,我们使用 scipy.optimize.curve_fit() 来查找  和
和 
>>> params, _ = sp.optimize.curve_fit(f, x, y, p0=[2, 1, 3])
>>> params
array([2.900026  , 1.50012043, 1.57079633])
>>> ref = [a, b, np.pi/2]  # what we'd expect
>>> np.allclose(params, ref, rtol=1e-3)
True
1.5.5.3. 优化
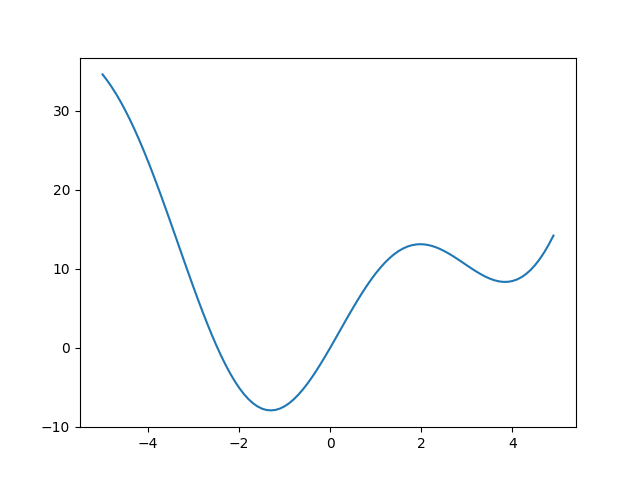
假设我们希望最小化单个变量  的标量值函数。
>>> def f(x):
...     return x**2 + 10*np.sin(x)
>>> x = np.arange(-5, 5, 0.1)
>>> plt.plot(x, f(x))
[<matplotlib.lines.Line2D object at ...>]
>>> plt.show()
我们可以看到该函数在  附近有一个局部最小值,在
  附近有一个全局最小值,但无法从图中确定精确值。
最适合此目的的函数是 scipy.optimize.minimize_scalar()。由于我们知道最小值的近似位置,因此我们将提供限制搜索范围到全局最小值附近的边界。
>>> res = sp.optimize.minimize_scalar(f, bounds=(-2, -1))
>>> res
 message: Solution found.
 success: True
  status: 0
     fun: -7.9458233756...
       x: -1.306440997...
     nit: 8
    nfev: 8
>>> res.fun == f(res.x)
np.True_
如果我们事先不知道全局最小值的近似位置,我们可以使用 SciPy 的全局最小值查找器之一,例如 scipy.optimize.differential_evolution()。我们需要传递 bounds,但它们不需要很严格。
>>> bounds=[(-5, 5)]  # list of lower, upper bound for each variable
>>> res = sp.optimize.differential_evolution(f, bounds=bounds)
>>> res
 message: Optimization terminated successfully.
 success: True
     fun: -7.9458233756...
       x: [-1.306e+00]
     nit: 6
    nfev: 111
     jac: [ 9.948e-06]
对于多变量优化,许多问题的良好选择是 scipy.optimize.minimize()。假设我们希望找到两个变量的二次函数  的最小值。
的最小值。
>>> def f(x):
...     return (x[0] - 1)**2 + (x[1] - 2)**2
与 scipy.optimize.root() 一样,scipy.optimize.minimize() 需要一个猜测值 x0。(请注意,这是两个变量的初始值,而不是我们碰巧标记为  的变量的值。)
>>> res = sp.optimize.minimize(f, x0=[0, 0])
>>> res
  message: Optimization terminated successfully.
  success: True
   status: 0
      fun: 1.70578...e-16
        x: [ 1.000e+00  2.000e+00]
      nit: 2
      jac: [ 3.219e-09 -8.462e-09]
 hess_inv: [[ 9.000e-01 -2.000e-01]
            [-2.000e-01  6.000e-01]]
     nfev: 9
     njev: 3
这仅仅触及了 SciPy 优化功能的表面,这些功能包括混合整数线性规划、约束非线性规划和分配问题的求解。有关更多信息,请参阅 scipy.optimize 的文档和高级章节 数学优化:查找函数的最小值。
有关另一个更高级的示例,请参阅 非线性最小二乘曲线拟合:在地形激光雷达数据中提取点的应用 上的总结练习。
1.5.6. 统计和随机数: scipy.stats
scipy.stats 包含 Python 中统计的基本工具。
1.5.6.1. 统计分布
考虑一个服从标准正态分布的随机变量。我们从随机变量中抽取一个包含 100000 个观测值的样本。样本的归一化直方图是随机变量概率密度函数 (PDF) 的估计量。
>>> dist = sp.stats.norm(loc=0, scale=1)  # standard normal distribution
>>> sample = dist.rvs(size=100000)  # "random variate sample"
>>> plt.hist(sample, bins=50, density=True, label='normalized histogram')
>>> x = np.linspace(-5, 5)
>>> plt.plot(x, dist.pdf(x), label='PDF')
[<matplotlib.lines.Line2D object at ...>]
>>> plt.legend()
<matplotlib.legend.Legend object at ...>
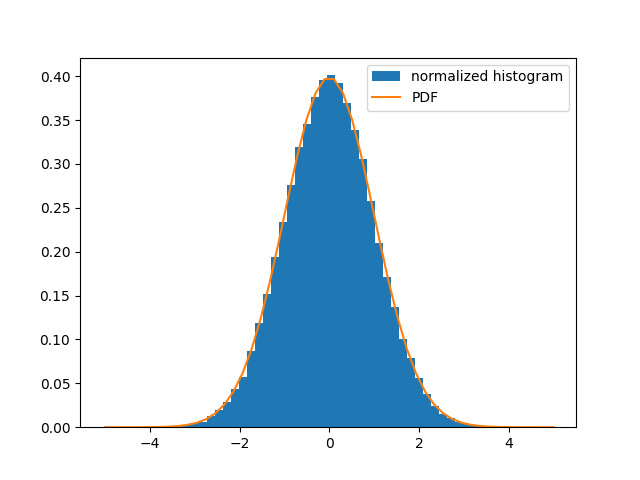
假设我们知道该样本是从属于正态分布族的分布中抽取的,但我们不知道特定分布的位置(均值)和尺度(标准差)。我们使用分布族的 fit 方法执行未知参数的最大似然估计。
>>> loc, scale = sp.stats.norm.fit(sample)
>>> loc
np.float64(0.0015767005...)
>>> scale
np.float64(0.9973396878...)
由于我们知道样本所来自的分布的真实参数,因此我们毫不奇怪地发现这些估计值是相似的。
1.5.6.2. 样本统计和假设检验
样本均值是样本所来自的分布的均值的估计量。
>>> np.mean(sample)
np.float64(0.001576700508...)
NumPy 包含一些最基本的样本统计量(例如 numpy.mean()、numpy.var()、numpy.percentile());scipy.stats 包含更多。例如,几何平均值是对于倾向于分布在多个数量级上的数据的常用集中趋势度量。
>>> sp.stats.gmean(2**sample)
np.float64(1.0010934829...)
SciPy 还包含各种假设检验,这些检验会生成样本统计量和 p 值。例如,假设我们希望检验 sample 是否是从正态分布中抽取的零假设。
>>> res = sp.stats.normaltest(sample)
>>> res.statistic
np.float64(5.20841759...)
>>> res.pvalue
np.float64(0.07396163283...)
在这里,statistic 是一个样本统计量,对于从非正态分布中抽取的样本,该统计量往往较高。pvalue 是对于已从正态分布中抽取的样本观察到如此高的统计量值的概率。如果 p 值异常小,则可以将其视为证据表明 sample未从正态分布中抽取。我们的统计量和 p 值适中,因此检验无定论。
scipy.stats 还有许多其他功能,包括循环统计、准蒙特卡罗方法和重采样方法。有关更多信息,请参阅 scipy.stats 的文档和高级章节 statistics。
1.5.7. 数值积分: scipy.integrate
1.5.7.1. 求积
假设我们希望计算定积分  的数值解。
的数值解。 scipy.integrate.quad() 根据参数选择几种自适应技术中的一种,因此是推荐用于单变量函数积分的首选方法。
>>> integral, error_estimate = sp.integrate.quad(np.sin, 0, np.pi/2)
>>> np.allclose(integral, 1)  # numerical result ~ analytical result
True
>>> abs(integral - 1) < error_estimate  #  actual error < estimated error
True
scipy.integrate 中提供了其他用于数值求积的功能,包括多变量函数的积分和从样本中近似积分。
1.5.7.2. 初值问题
scipy.integrate 还提供了用于积分常微分方程 (ODE) 的例程。例如,scipy.integrate.solve_ivp() 集成了以下形式的 ODE:

从初始时间  和初始状态
和初始状态  到最终时间
到最终时间  ,或直到发生事件(例如,达到指定状态)。
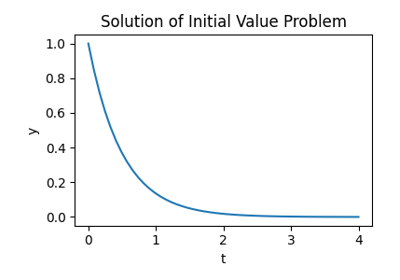
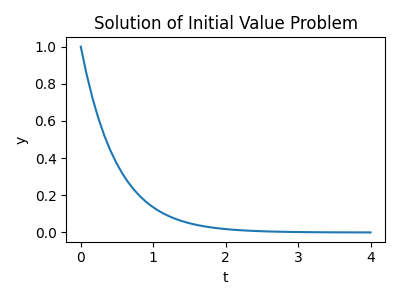
作为介绍,考虑由  和初始条件
和初始条件  在区间
在区间  上给出的初值问题。
>>> def f(t, y):
...     return -2 * y
然后,要计算 y 作为时间的函数
>>> t_span = (0, 4)  # time interval
>>> t_eval = np.linspace(*t_span)  # times at which to evaluate `y`
>>> y0 = [1,]  # initial state
>>> res = sp.integrate.solve_ivp(f, t_span=t_span, y0=y0, t_eval=t_eval)
并绘制结果
>>> plt.plot(res.t, res.y[0])
[<matplotlib.lines.Line2D object at ...>]
>>> plt.xlabel('t')
Text(0.5, ..., 't')
>>> plt.ylabel('y')
Text(..., 0.5, 'y')
>>> plt.title('Solution of Initial Value Problem')
Text(0.5, 1.0, 'Solution of Initial Value Problem')
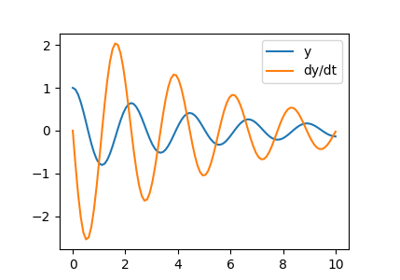
让我们积分一个更复杂的 ODE:一个阻尼弹簧质量振荡器。连接到弹簧上的质量的位置服从二阶 ODE  ,其自然频率为
  ,阻尼比为
,阻尼比为  ,弹簧常数为
  ,质量为
,质量为  ,阻尼系数为
  。
。
在使用 scipy.integrate.solve_ivp() 之前,需要将二阶 ODE 转换为一阶 ODE 系统。请注意

如果我们定义 ![z = [z_0, z_1]](../../_images/math/8c62066b6fd82a8da734b015b734d7cde2c9b469.png) ,其中
,其中  和
和  ,则一阶方程

等价于原始的二阶方程。
我们设置
>>> m = 0.5  # kg
>>> k = 4  # N/m
>>> c = 0.4  # N s/m
>>> zeta = c / (2 * m * np.sqrt(k/m))
>>> omega = np.sqrt(k / m)
并定义计算  的函数。
的函数。
>>> def f(t, z, zeta, omega):
...     return (z[1], -2.0 * zeta * omega * z[1] - omega**2 * z[0])
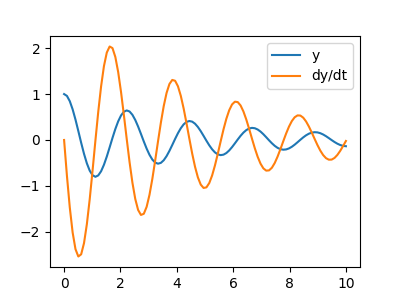
系统的积分如下
>>> t_span = (0, 10)
>>> t_eval = np.linspace(*t_span, 100)
>>> z0 = [1, 0]
>>> res = sp.integrate.solve_ivp(f, t_span, z0, t_eval=t_eval,
...                              args=(zeta, omega), method='LSODA')
提示
使用选项 method=’LSODA’,scipy.integrate.solve_ivp() 使用 LSODA(用于常微分方程的利弗莫尔求解器,具有用于刚性和非刚性问题的自动方法切换)。有关更多详细信息,请参阅ODEPACK Fortran 库。
1.5.8. 快速傅里叶变换: scipy.fft
scipy.fft 模块计算快速傅里叶变换 (FFT) 并提供处理它们的实用程序。一些重要的函数是
scipy.fft.fft()用于计算 FFTscipy.fft.fftfreq()用于生成采样频率scipy.fft.ifft()用于计算逆 FFT,从频域到信号空间
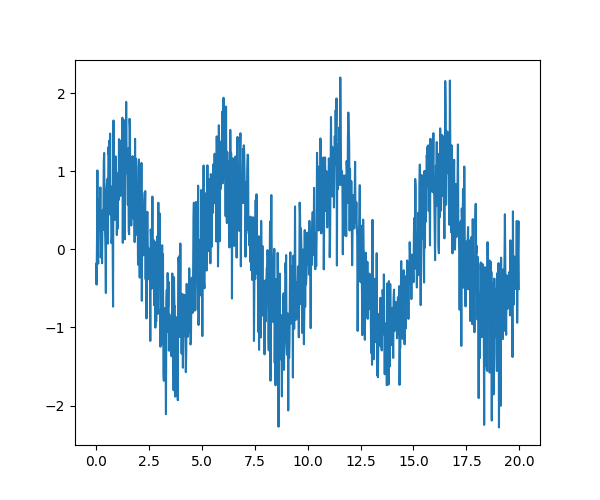
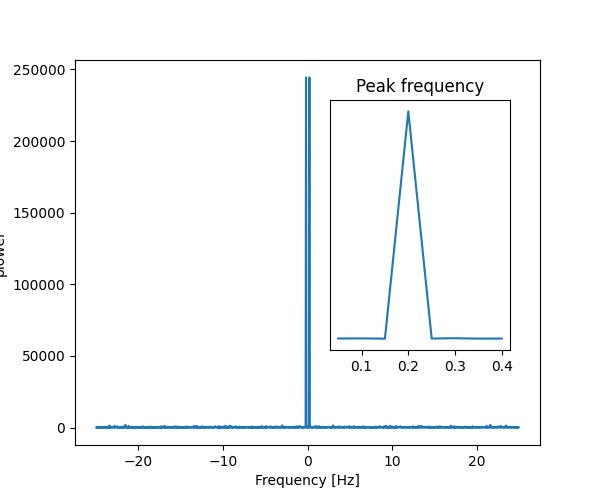
举例来说,一个(带噪声的)输入信号(sig)及其 FFT
>>> sig_fft = sp.fft.fft(sig)
>>> freqs = sp.fft.fftfreq(sig.size, d=time_step)
信号 |
FFT |
由于信号来自实值函数,因此傅里叶变换是对称的。
可以使用 freqs[power.argmax()] 找到峰值信号频率。
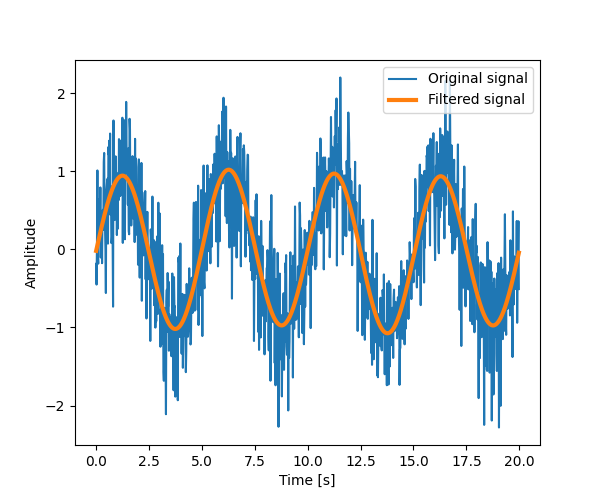
将高于此频率的傅里叶分量设置为零,并使用 scipy.fft.ifft() 反转 FFT,得到滤波后的信号。
注意
此示例的代码可以在这里找到 here
完整的工作示例
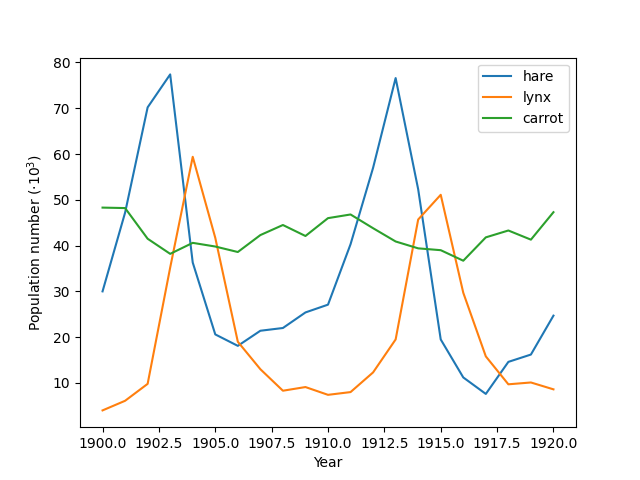
粗略的周期性查找 (link) |
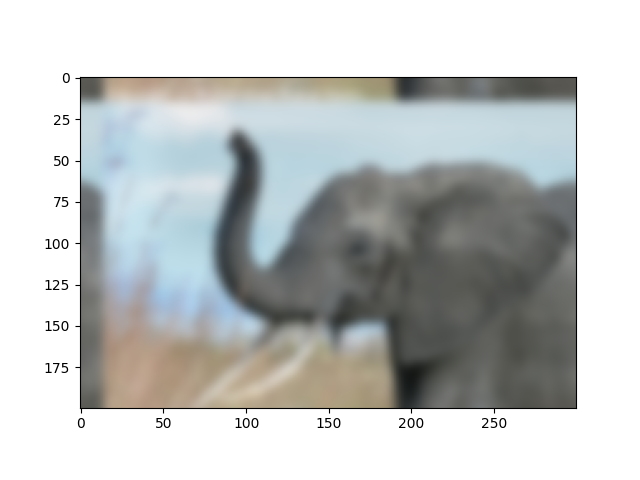
高斯图像模糊 (link) |
|---|---|
1.5.9. 信号处理: scipy.signal
提示
scipy.signal 用于典型的信号处理:1D、规则采样的信号。
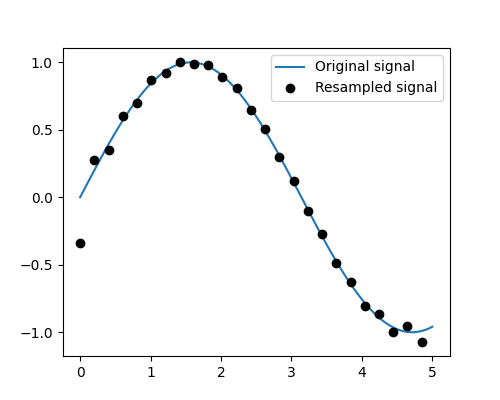
重采样 scipy.signal.resample():使用 FFT 将信号重采样到 n 个点。
>>> t = np.linspace(0, 5, 100)
>>> x = np.sin(t)

>>> x_resampled = sp.signal.resample(x, 25)

>>> plt.plot(t, x)
[<matplotlib.lines.Line2D object at ...>]
>>> plt.plot(t[::4], x_resampled, 'ko')
[<matplotlib.lines.Line2D object at ...>]
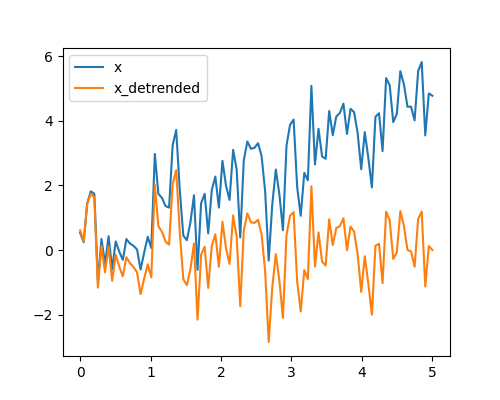
去趋势化 scipy.signal.detrend(): 从信号中去除线性趋势
>>> t = np.linspace(0, 5, 100)
>>> rng = np.random.default_rng()
>>> x = t + rng.normal(size=100)

>>> x_detrended = sp.signal.detrend(x)

>>> plt.plot(t, x)
[<matplotlib.lines.Line2D object at ...>]
>>> plt.plot(t, x_detrended)
[<matplotlib.lines.Line2D object at ...>]
滤波:对于非线性滤波,scipy.signal 提供了滤波功能(中值滤波 scipy.signal.medfilt(),维纳滤波 scipy.signal.wiener()),但我们将在图像部分讨论这些内容。
提示
scipy.signal 还提供了一套完整的线性滤波器设计工具(有限和无限冲激响应滤波器),但这超出了本教程的范围。
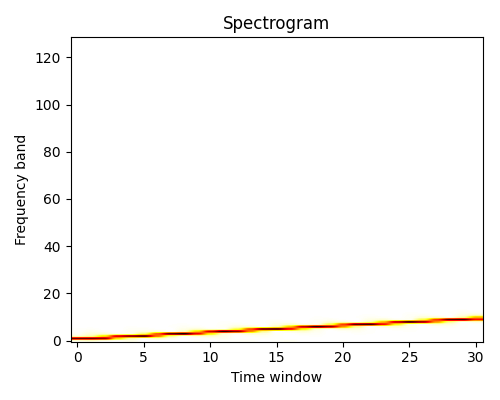
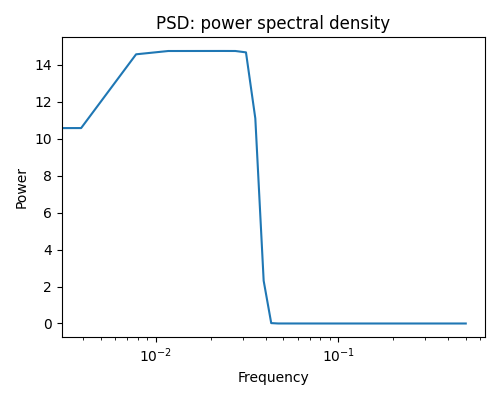
频谱分析:scipy.signal.spectrogram() 计算频谱图 - 连续时间窗口上的频率谱 -,而 scipy.signal.welch() 计算功率谱密度 (PSD)。
1.5.10. 图像处理: scipy.ndimage
scipy.ndimage 提供了对 n 维数组作为图像的处理。
1.5.10.1. 图像的几何变换
更改方向、分辨率等。
>>> import scipy as sp

>>> # Load an image
>>> face = sp.datasets.face(gray=True)

>>> # Shift, rotate and zoom it
>>> shifted_face = sp.ndimage.shift(face, (50, 50))
>>> shifted_face2 = sp.ndimage.shift(face, (50, 50), mode='nearest')
>>> rotated_face = sp.ndimage.rotate(face, 30)
>>> cropped_face = face[50:-50, 50:-50]
>>> zoomed_face = sp.ndimage.zoom(face, 2)
>>> zoomed_face.shape
(1536, 2048)

>>> plt.subplot(151)
<Axes: >

>>> plt.imshow(shifted_face, cmap=plt.cm.gray)
<matplotlib.image.AxesImage object at 0x...>

>>> plt.axis('off')
(np.float64(-0.5), np.float64(1023.5), np.float64(767.5), np.float64(-0.5))

>>> # etc.
1.5.10.2. 图像滤波
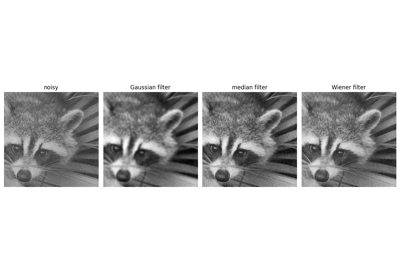
生成一张有噪声的脸
>>> import scipy as sp
>>> face = sp.datasets.face(gray=True)
>>> face = face[:512, -512:]  # crop out square on right
>>> import numpy as np
>>> noisy_face = np.copy(face).astype(float)
>>> rng = np.random.default_rng()
>>> noisy_face += face.std() * 0.5 * rng.standard_normal(face.shape)
对其应用各种滤波器
>>> blurred_face = sp.ndimage.gaussian_filter(noisy_face, sigma=3)
>>> median_face = sp.ndimage.median_filter(noisy_face, size=5)
>>> wiener_face = sp.signal.wiener(noisy_face, (5, 5))

其他滤波器可以在 scipy.ndimage.filters 和 scipy.signal 中找到,并可以应用于图像。
1.5.10.3. 数学形态学
提示
数学形态学起源于集合论。它描述并转换几何结构。特别是二值(黑白)图像可以使用该理论进行转换:要转换的集合是非零值像素的相邻像素集。该理论也扩展到灰度图像。

数学形态学操作使用结构元素来修改几何结构。
让我们首先生成一个结构元素
>>> el = sp.ndimage.generate_binary_structure(2, 1)
>>> el
array([[False, True, False],
       [...True, True, True],
       [False, True, False]])
>>> el.astype(int)
array([[0, 1, 0],
       [1, 1, 1],
       [0, 1, 0]])
腐蚀
scipy.ndimage.binary_erosion()>>> a = np.zeros((7, 7), dtype=int) >>> a[1:6, 2:5] = 1 >>> a array([[0, 0, 0, 0, 0, 0, 0], [0, 0, 1, 1, 1, 0, 0], [0, 0, 1, 1, 1, 0, 0], [0, 0, 1, 1, 1, 0, 0], [0, 0, 1, 1, 1, 0, 0], [0, 0, 1, 1, 1, 0, 0], [0, 0, 0, 0, 0, 0, 0]]) >>> sp.ndimage.binary_erosion(a).astype(a.dtype) array([[0, 0, 0, 0, 0, 0, 0], [0, 0, 0, 0, 0, 0, 0], [0, 0, 0, 1, 0, 0, 0], [0, 0, 0, 1, 0, 0, 0], [0, 0, 0, 1, 0, 0, 0], [0, 0, 0, 0, 0, 0, 0], [0, 0, 0, 0, 0, 0, 0]]) >>> # Erosion removes objects smaller than the structure >>> sp.ndimage.binary_erosion(a, structure=np.ones((5,5))).astype(a.dtype) array([[0, 0, 0, 0, 0, 0, 0], [0, 0, 0, 0, 0, 0, 0], [0, 0, 0, 0, 0, 0, 0], [0, 0, 0, 0, 0, 0, 0], [0, 0, 0, 0, 0, 0, 0], [0, 0, 0, 0, 0, 0, 0], [0, 0, 0, 0, 0, 0, 0]])
膨胀
scipy.ndimage.binary_dilation()>>> a = np.zeros((5, 5)) >>> a[2, 2] = 1 >>> a array([[0., 0., 0., 0., 0.], [0., 0., 0., 0., 0.], [0., 0., 1., 0., 0.], [0., 0., 0., 0., 0.], [0., 0., 0., 0., 0.]]) >>> sp.ndimage.binary_dilation(a).astype(a.dtype) array([[0., 0., 0., 0., 0.], [0., 0., 1., 0., 0.], [0., 1., 1., 1., 0.], [0., 0., 1., 0., 0.], [0., 0., 0., 0., 0.]])
开运算
scipy.ndimage.binary_opening()>>> a = np.zeros((5, 5), dtype=int) >>> a[1:4, 1:4] = 1 >>> a[4, 4] = 1 >>> a array([[0, 0, 0, 0, 0], [0, 1, 1, 1, 0], [0, 1, 1, 1, 0], [0, 1, 1, 1, 0], [0, 0, 0, 0, 1]]) >>> # Opening removes small objects >>> sp.ndimage.binary_opening(a, structure=np.ones((3, 3))).astype(int) array([[0, 0, 0, 0, 0], [0, 1, 1, 1, 0], [0, 1, 1, 1, 0], [0, 1, 1, 1, 0], [0, 0, 0, 0, 0]]) >>> # Opening can also smooth corners >>> sp.ndimage.binary_opening(a).astype(int) array([[0, 0, 0, 0, 0], [0, 0, 1, 0, 0], [0, 1, 1, 1, 0], [0, 0, 1, 0, 0], [0, 0, 0, 0, 0]])
开运算去除小结构,而闭运算填充小孔。因此,此类操作可用于“清理”图像。
>>> a = np.zeros((50, 50))
>>> a[10:-10, 10:-10] = 1
>>> rng = np.random.default_rng()
>>> a += 0.25 * rng.standard_normal(a.shape)
>>> mask = a>=0.5
>>> opened_mask = sp.ndimage.binary_opening(mask)
>>> closed_mask = sp.ndimage.binary_closing(opened_mask)

对于灰度图像,腐蚀(或膨胀)相当于用以感兴趣像素为中心的结构元素覆盖的像素中的最小(或最大)值替换像素。
>>> a = np.zeros((7, 7), dtype=int)
>>> a[1:6, 1:6] = 3
>>> a[4, 4] = 2; a[2, 3] = 1
>>> a
array([[0, 0, 0, 0, 0, 0, 0],
       [0, 3, 3, 3, 3, 3, 0],
       [0, 3, 3, 1, 3, 3, 0],
       [0, 3, 3, 3, 3, 3, 0],
       [0, 3, 3, 3, 2, 3, 0],
       [0, 3, 3, 3, 3, 3, 0],
       [0, 0, 0, 0, 0, 0, 0]])
>>> sp.ndimage.grey_erosion(a, size=(3, 3))
array([[0, 0, 0, 0, 0, 0, 0],
       [0, 0, 0, 0, 0, 0, 0],
       [0, 0, 1, 1, 1, 0, 0],
       [0, 0, 1, 1, 1, 0, 0],
       [0, 0, 3, 2, 2, 0, 0],
       [0, 0, 0, 0, 0, 0, 0],
       [0, 0, 0, 0, 0, 0, 0]])
1.5.10.4. 连通分量和图像测量
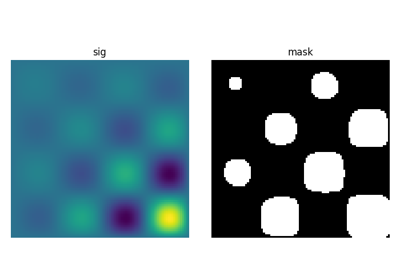
让我们首先生成一个漂亮的合成二值图像。
>>> x, y = np.indices((100, 100))
>>> sig = np.sin(2*np.pi*x/50.) * np.sin(2*np.pi*y/50.) * (1+x*y/50.**2)**2
>>> mask = sig > 1
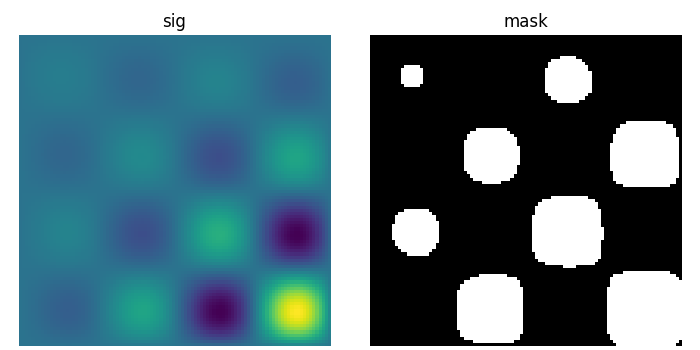
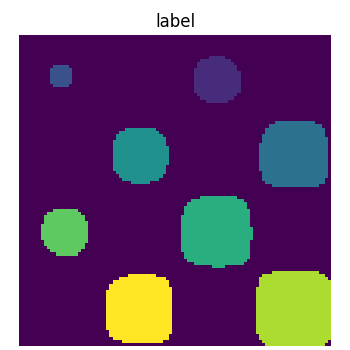
scipy.ndimage.label() 为每个连通分量分配一个不同的标签
>>> labels, nb = sp.ndimage.label(mask)
>>> nb
8
现在计算每个连通分量的测量值
>>> areas = sp.ndimage.sum(mask, labels, range(1, labels.max()+1))
>>> areas   # The number of pixels in each connected component
array([190.,   45.,  424.,  278.,  459.,  190.,  549.,  424.])
>>> maxima = sp.ndimage.maximum(sig, labels, range(1, labels.max()+1))
>>> maxima  # The maximum signal in each connected component
array([ 1.80238238,   1.13527605,   5.51954079,   2.49611818, 6.71673619,
        1.80238238,  16.76547217,   5.51954079])
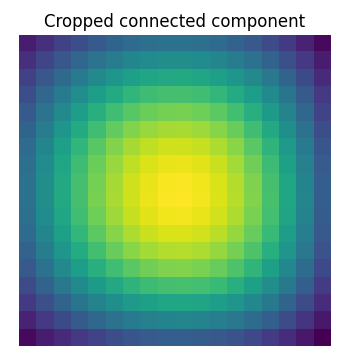
提取第 4 个连通分量,并在其周围裁剪数组
>>> sp.ndimage.find_objects(labels)[3]
(slice(30, 48, None), slice(30, 48, None))
>>> sl = sp.ndimage.find_objects(labels)[3]
>>> import matplotlib.pyplot as plt
>>> plt.imshow(sig[sl])
<matplotlib.image.AxesImage object at ...>
有关更高级的示例,请参阅有关 图像处理应用:计数气泡和未熔颗粒 的总结练习。
1.5.11. 科学计算总结练习
总结练习主要使用 NumPy、SciPy 和 Matplotlib。它们提供了一些使用 Python 进行科学计算的真实案例。现在已经介绍了使用 NumPy 和 SciPy 的基础知识,感兴趣的用户可以尝试这些练习。
练习
建议的解决方案
