注意
转到末尾 下载完整示例代码。
1.5.12.5. 正态分布:直方图和 PDF
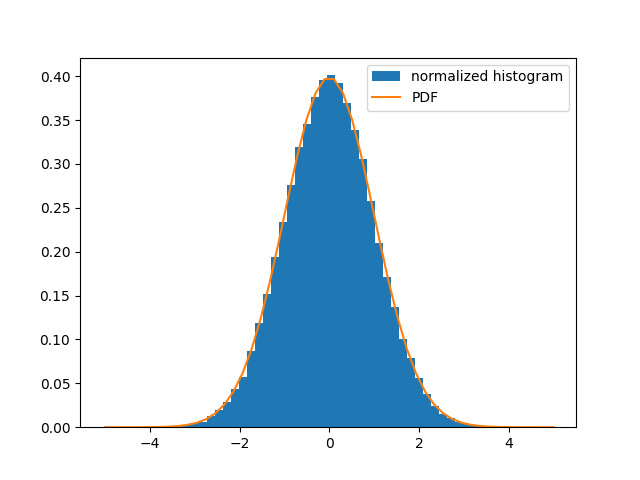
探索正态分布:由样本构建的直方图和 PDF(概率密度函数)。

import numpy as np
import scipy as sp
import matplotlib.pyplot as plt

dist = sp.stats.norm(loc=0, scale=1)  # standard normal distribution
sample = dist.rvs(size=100000)  # "random variate sample"
plt.hist(
    sample,
    bins=51,  # group the observations into 50 bins
    density=True,  # normalize the frequencies
    label="normalized histogram",
)

x = np.linspace(-5, 5)  # possible values of the random variable
plt.plot(x, dist.pdf(x), label="PDF")
plt.legend()
plt.show()
脚本的总运行时间:(0 分钟 0.101 秒)