注意
转到末尾 下载完整的示例代码。
1.5.12.16. 用于滤波的 FFT 绘制和操作
绘制信号 FFT 的功率并进行逆 FFT 重构信号。
此示例演示了 scipy.fft.fft()、scipy.fft.fftfreq() 和 scipy.fft.ifft()。它实现了一个非常次优的基本滤波器,不应使用。
import numpy as np
import scipy as sp
import matplotlib.pyplot as plt
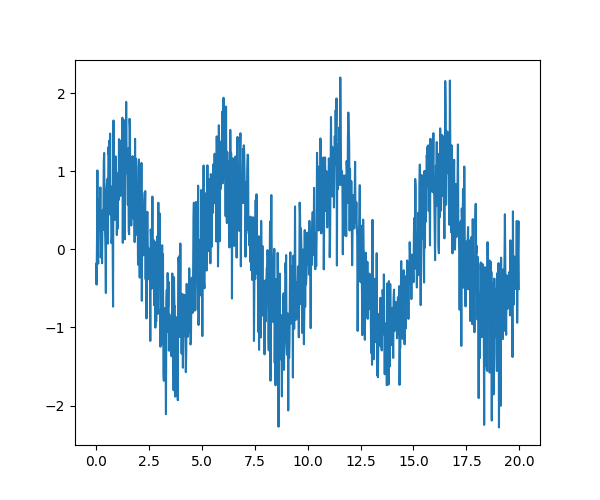
生成信号
# Seed the random number generator
rng = np.random.default_rng(27446968)

time_step = 0.02
period = 5.0

time_vec = np.arange(0, 20, time_step)
sig = np.sin(2 * np.pi / period * time_vec) + 0.5 * rng.normal(size=time_vec.size)

plt.figure(figsize=(6, 5))
plt.plot(time_vec, sig, label="Original signal")

[<matplotlib.lines.Line2D object at 0x7f791ebdd430>]
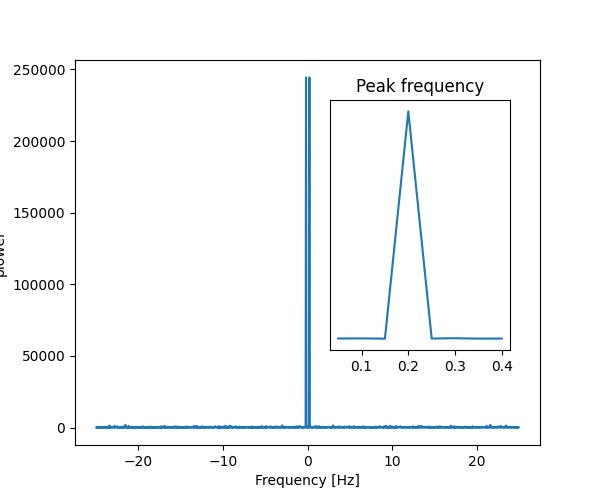
计算并绘制功率
# The FFT of the signal
sig_fft = sp.fft.fft(sig)

# And the power (sig_fft is of complex dtype)
power = np.abs(sig_fft) ** 2

# The corresponding frequencies
sample_freq = sp.fft.fftfreq(sig.size, d=time_step)

# Plot the FFT power
plt.figure(figsize=(6, 5))
plt.plot(sample_freq, power)
plt.xlabel("Frequency [Hz]")
plt.ylabel("plower")

# Find the peak frequency: we can focus on only the positive frequencies
pos_mask = np.where(sample_freq > 0)
freqs = sample_freq[pos_mask]
peak_freq = freqs[power[pos_mask].argmax()]

# Check that it does indeed correspond to the frequency that we generate
# the signal with
np.allclose(peak_freq, 1.0 / period)

# An inner plot to show the peak frequency
axes = plt.axes((0.55, 0.3, 0.3, 0.5))
plt.title("Peak frequency")
plt.plot(freqs[:8], power[pos_mask][:8])
plt.setp(axes, yticks=[])

# scipy.signal.find_peaks_cwt can also be used for more advanced
# peak detection

[]
去除所有高频
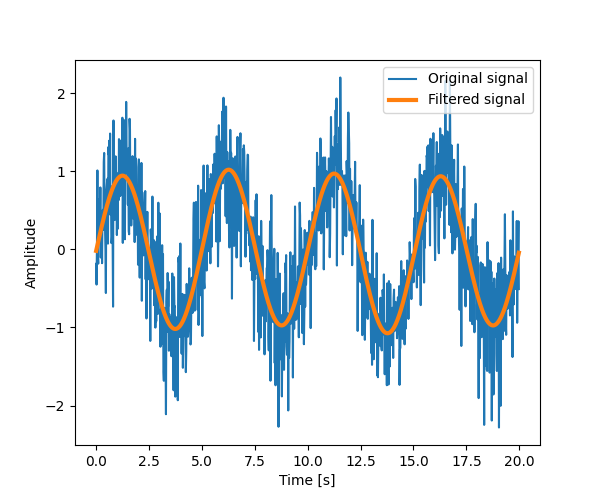
现在我们去除所有高频,并将信号从频域转换回时域。
high_freq_fft = sig_fft.copy()
high_freq_fft[np.abs(sample_freq) > peak_freq] = 0
filtered_sig = sp.fft.ifft(high_freq_fft)

plt.figure(figsize=(6, 5))
plt.plot(time_vec, sig, label="Original signal")
plt.plot(time_vec, filtered_sig, linewidth=3, label="Filtered signal")
plt.xlabel("Time [s]")
plt.ylabel("Amplitude")

plt.legend(loc="best")

/opt/hostedtoolcache/Python/3.12.6/x64/lib/python3.12/site-packages/matplotlib/cbook.py:1762: ComplexWarning: Casting complex values to real discards the imaginary part
  return math.isfinite(val)
/opt/hostedtoolcache/Python/3.12.6/x64/lib/python3.12/site-packages/matplotlib/cbook.py:1398: ComplexWarning: Casting complex values to real discards the imaginary part
  return np.asarray(x, float)

<matplotlib.legend.Legend object at 0x7f791ec0f110>
注意 实际上,这是一种糟糕的滤波器创建方法:这种频率空间中的粗暴截断无法控制信号失真。
滤波器应该使用 SciPy 滤波器设计代码创建
plt.show()
脚本总运行时间:(0 分钟 0.203 秒)