注意
转到结尾 下载完整的示例代码。
3.1.6.7. 可视化影响工资的因素
此示例使用 seaborn 快速绘制与工资、经验和教育相关的各种因素。
Seaborn (https://seaborn.org.cn) 是一个将可视化和统计拟合结合起来以显示数据趋势的库。
请注意,导入 seaborn 会更改 matplotlib 样式,使其具有“类似 Excel”的感觉。此更改会影响其他 matplotlib 图形。要在此示例运行后恢复默认值,我们需要调用 plt.rcdefaults()。
# Standard library imports
import os

import matplotlib.pyplot as plt
加载数据
import pandas
import requests

if not os.path.exists("wages.txt"):
    # Download the file if it is not present
    r = requests.get("http://lib.stat.cmu.edu/datasets/CPS_85_Wages")
    with open("wages.txt", "wb") as f:
        f.write(r.content)

# Give names to the columns
names = [
    "EDUCATION: Number of years of education",
    "SOUTH: 1=Person lives in South, 0=Person lives elsewhere",
    "SEX: 1=Female, 0=Male",
    "EXPERIENCE: Number of years of work experience",
    "UNION: 1=Union member, 0=Not union member",
    "WAGE: Wage (dollars per hour)",
    "AGE: years",
    "RACE: 1=Other, 2=Hispanic, 3=White",
    "OCCUPATION: 1=Management, 2=Sales, 3=Clerical, 4=Service, 5=Professional, 6=Other",
    "SECTOR: 0=Other, 1=Manufacturing, 2=Construction",
    "MARR: 0=Unmarried,  1=Married",
]

short_names = [n.split(":")[0] for n in names]

data = pandas.read_csv(
    "wages.txt", skiprows=27, skipfooter=6, sep=None, header=None, engine="python"
)
data.columns = pandas.Index(short_names)

# Log-transform the wages, because they typically are increased with
# multiplicative factors
import numpy as np

data["WAGE"] = np.log10(data["WAGE"])
绘制突出显示不同方面的散点矩阵
import seaborn

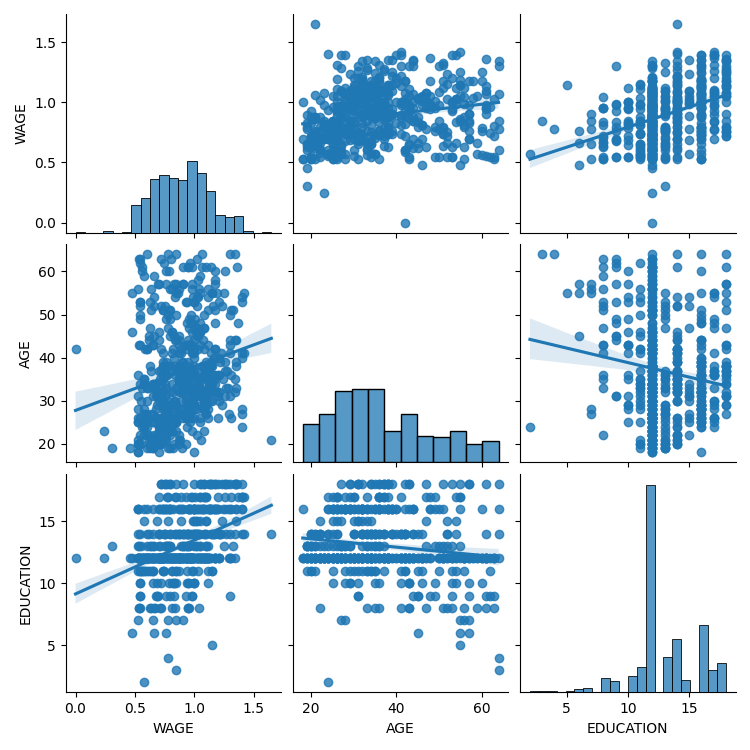
seaborn.pairplot(data, vars=["WAGE", "AGE", "EDUCATION"], kind="reg")

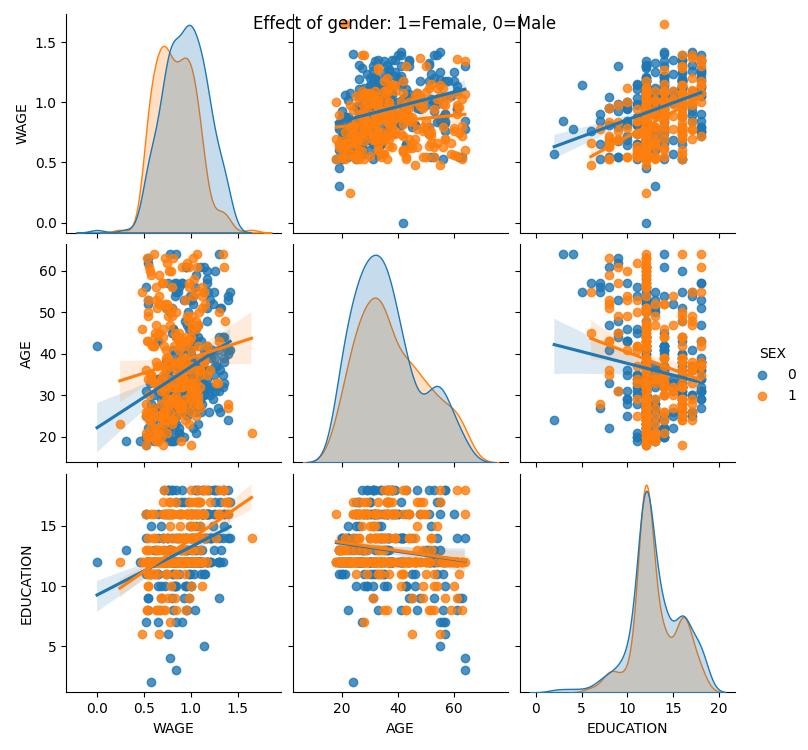
seaborn.pairplot(data, vars=["WAGE", "AGE", "EDUCATION"], kind="reg", hue="SEX")
plt.suptitle("Effect of gender: 1=Female, 0=Male")

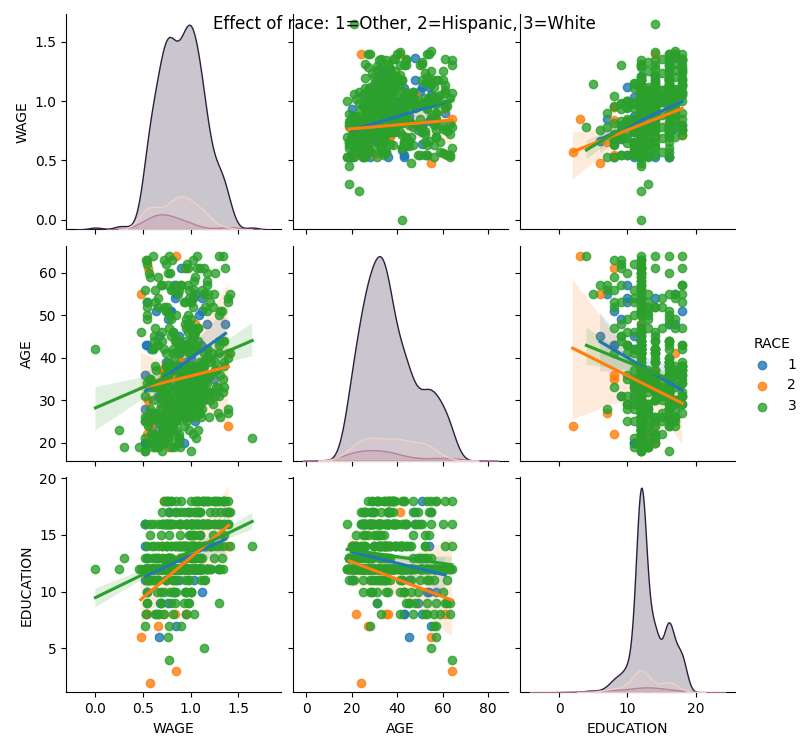
seaborn.pairplot(data, vars=["WAGE", "AGE", "EDUCATION"], kind="reg", hue="RACE")
plt.suptitle("Effect of race: 1=Other, 2=Hispanic, 3=White")

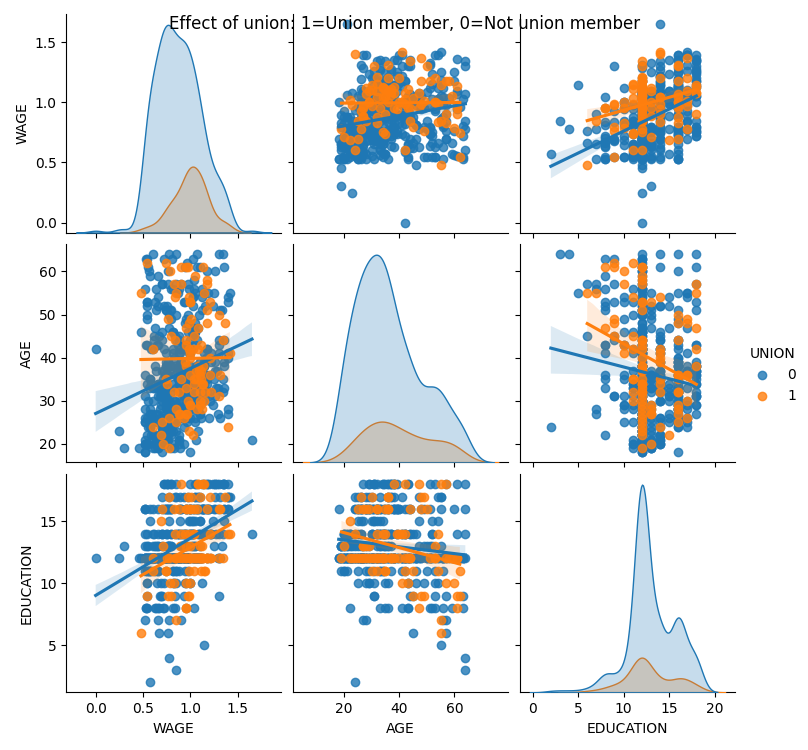
seaborn.pairplot(data, vars=["WAGE", "AGE", "EDUCATION"], kind="reg", hue="UNION")
plt.suptitle("Effect of union: 1=Union member, 0=Not union member")
Text(0.5, 0.98, 'Effect of union: 1=Union member, 0=Not union member')
绘制简单回归
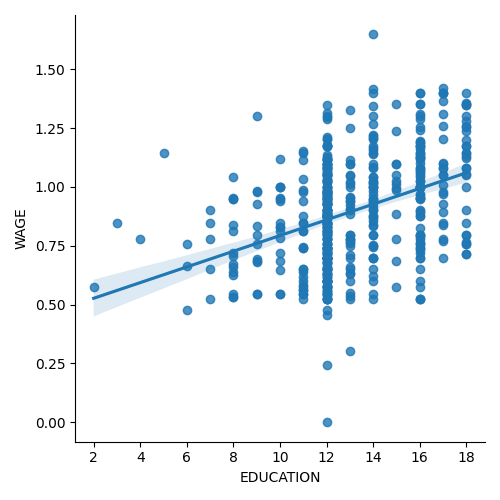
seaborn.lmplot(y="WAGE", x="EDUCATION", data=data)

plt.show()
脚本总运行时间:(0 分钟 9.417 秒)
