注意
转到结尾 下载完整的示例代码。
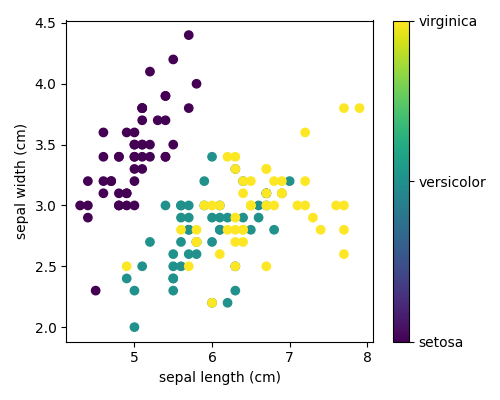
3.4.8.4. 绘制鸢尾花数据集的二维视图
绘制鸢尾花数据集的两个特征的简单散点图。
请注意,此数据集更详细的可视化在Python 中的统计学章节中进行了介绍。
# Load the data
from sklearn.datasets import load_iris

iris = load_iris()

from matplotlib import ticker
import matplotlib.pyplot as plt

# The indices of the features that we are plotting
x_index = 0
y_index = 1

# this formatter will label the colorbar with the correct target names
formatter = ticker.FuncFormatter(lambda i, *args: iris.target_names[int(i)])

plt.figure(figsize=(5, 4))
plt.scatter(iris.data[:, x_index], iris.data[:, y_index], c=iris.target)
plt.colorbar(ticks=[0, 1, 2], format=formatter)
plt.xlabel(iris.feature_names[x_index])
plt.ylabel(iris.feature_names[y_index])

plt.tight_layout()
plt.show()
脚本总运行时间:(0 分钟 0.091 秒)