注意
转到结尾 下载完整示例代码。
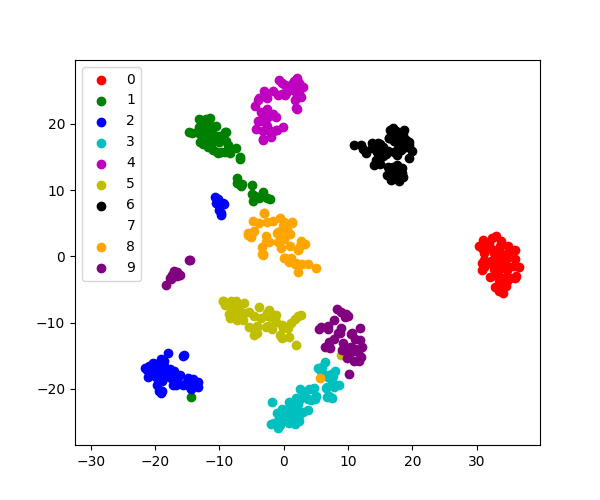
3.4.8.5. 使用 tSNE 可视化数字
在这里,我们使用 sklearn.manifold.TSNE 来可视化数字数据集。事实上,数字是 8*8 = 64 维空间中的向量。我们希望将它们投影到 2D 空间中以进行可视化。tSNE 通常是一个很好的解决方案,因为它根据数据点的局部关系对它们进行分组和分离。
加载鸢尾花数据
from sklearn import datasets

digits = datasets.load_digits()
# Take the first 500 data points: it's hard to see 1500 points
X = digits.data[:500]
y = digits.target[:500]
使用 TSNE 进行拟合和转换
将数据投影到 2D 空间
可视化数据
target_ids = range(len(digits.target_names))

import matplotlib.pyplot as plt

plt.figure(figsize=(6, 5))
colors = "r", "g", "b", "c", "m", "y", "k", "w", "orange", "purple"
for i, c, label in zip(target_ids, colors, digits.target_names, strict=True):
    plt.scatter(X_2d[y == i, 0], X_2d[y == i, 1], c=c, label=label)
plt.legend()
plt.show()
脚本的总运行时间:(0 分钟 1.204 秒)