注意
转到结尾 下载完整的示例代码。
3.4.8.12. 基于鸢尾花数据集的最近邻预测
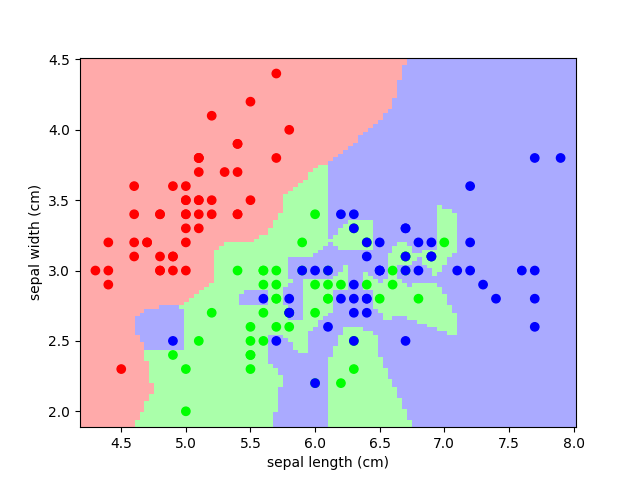
绘制鸢尾花数据集上最近邻决策的决策边界,首先使用单个最近邻,然后使用 3 个最近邻。
import numpy as np
import matplotlib.pyplot as plt
from sklearn import neighbors, datasets
from matplotlib.colors import ListedColormap

# Create color maps for 3-class classification problem, as with iris
cmap_light = ListedColormap(["#FFAAAA", "#AAFFAA", "#AAAAFF"])
cmap_bold = ListedColormap(["#FF0000", "#00FF00", "#0000FF"])

iris = datasets.load_iris()
X = iris.data[:, :2]  # we only take the first two features. We could
# avoid this ugly slicing by using a two-dim dataset
y = iris.target

knn = neighbors.KNeighborsClassifier(n_neighbors=1)
knn.fit(X, y)

x_min, x_max = X[:, 0].min() - 0.1, X[:, 0].max() + 0.1
y_min, y_max = X[:, 1].min() - 0.1, X[:, 1].max() + 0.1
xx, yy = np.meshgrid(np.linspace(x_min, x_max, 100), np.linspace(y_min, y_max, 100))
Z = knn.predict(np.c_[xx.ravel(), yy.ravel()])
将结果放入彩色图中
Z = Z.reshape(xx.shape)
plt.figure()
plt.pcolormesh(xx, yy, Z, cmap=cmap_light)

# Plot also the training points
plt.scatter(X[:, 0], X[:, 1], c=y, cmap=cmap_bold)
plt.xlabel("sepal length (cm)")
plt.ylabel("sepal width (cm)")
plt.axis("tight")
(np.float64(4.180808080808081), np.float64(8.019191919191918), np.float64(1.8868686868686868), np.float64(4.513131313131313))
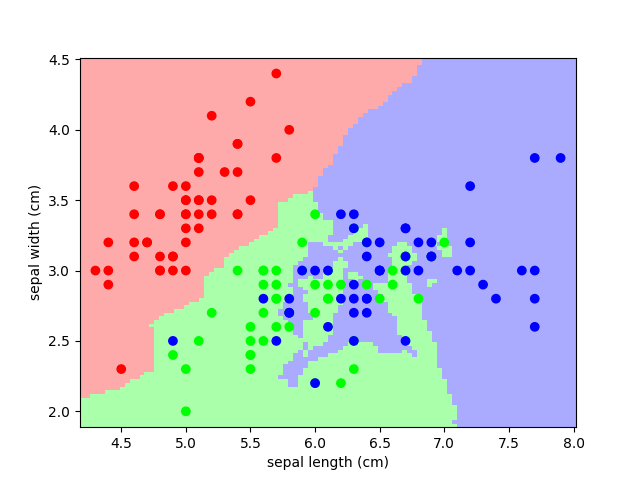
现在,使用 3 个邻居重新进行分析
knn = neighbors.KNeighborsClassifier(n_neighbors=3)
knn.fit(X, y)

Z = knn.predict(np.c_[xx.ravel(), yy.ravel()])

# Put the result into a color plot
Z = Z.reshape(xx.shape)
plt.figure()
plt.pcolormesh(xx, yy, Z, cmap=cmap_light)

# Plot also the training points
plt.scatter(X[:, 0], X[:, 1], c=y, cmap=cmap_bold)
plt.xlabel("sepal length (cm)")
plt.ylabel("sepal width (cm)")
plt.axis("tight")

plt.show()
脚本的总运行时间: (0 分钟 0.794 秒)