3.3. scikit-image: 图像处理
作者: Emmanuelle Gouillart
scikit-image 是一个专门用于图像处理的 Python 包,它使用 NumPy 数组作为图像对象。本章描述了如何使用 scikit-image 来执行各种图像处理任务,以及它与其他科学 Python 模块(如 NumPy 和 SciPy)的关系。
另请参阅
对于基本的图像操作,如图像裁剪或简单滤波,可以使用 NumPy 和 SciPy 来实现大量的简单操作。请参阅 使用 NumPy 和 SciPy 进行图像操作和处理.
请注意,在阅读本章之前,您应该熟悉上一章的内容,因为诸如掩码和标记之类的基本操作是本章的先决条件。
3.3.1. 简介和概念
图像为 NumPy 数组 np.ndarray
- 图像:
np.ndarray- 像素:
数组值:
a[2, 3]- 通道:
数组维度
- 图像编码:
dtype(np.uint8,np.uint16,np.float)- 滤波器:
函数 (
numpy,skimage,scipy)
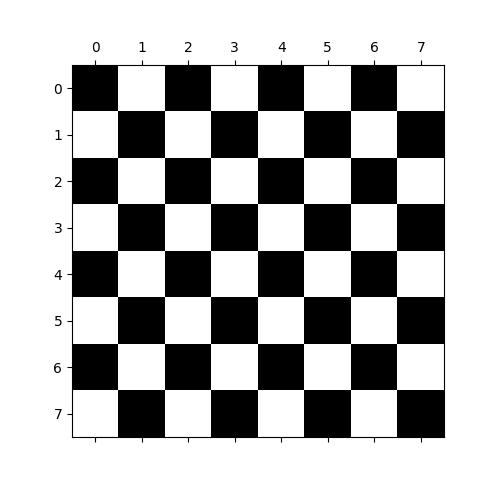
>>> import numpy as np
>>> check = np.zeros((8, 8))
>>> check[::2, 1::2] = 1
>>> check[1::2, ::2] = 1
>>> import matplotlib.pyplot as plt
>>> plt.imshow(check, cmap='gray', interpolation='nearest')
<matplotlib.image.AxesImage object at ...>
3.3.1.1. scikit-image 和科学 Python 生态系统
scikit-image 被打包在 pip 和 conda 基于 Python 的安装中,以及大多数 Linux 发行版中。其他针对 NumPy 数组的图像处理和可视化 Python 包包括
scipy.ndimage用于 N 维数组。基本滤波、数学形态学、区域属性
- Mahotas
重点在于高速实现。
- Napari
一个使用 Qt 构建的快速、交互式、多维图像查看器。
一些强大的 C++ 图像处理库也具有 Python 绑定
在不同程度上,这些库往往不太符合 Python 的风格,也不太适合 NumPy。
3.3.1.2. scikit-image 中包含的内容
该库主要包含图像处理算法,但也包含一些实用函数来简化数据处理和处理。它包含以下子模块
color色彩空间转换。
data测试图像和示例数据。
draw在 NumPy 数组上操作的绘图基元(线条、文本等)。
exposure图像强度调整,例如直方图均衡化等。
feature特征检测和提取,例如纹理分析、角点等。
filters锐化、边缘查找、秩滤波、阈值化等。
graph图论运算,例如最短路径。
io读取、保存和显示图像和视频。
measure图像属性的测量,例如区域属性和轮廓。
metrics对应于图像的指标,例如距离指标、相似度等。
morphology形态学运算,例如开运算或骨架化。
restoration恢复算法,例如反卷积算法、降噪等。
segmentation将图像划分为多个区域。
transform几何变换和其他变换,例如旋转或 Radon 变换。
util通用实用程序。
3.3.2. 导入
我们使用以下约定导入 scikit-image
>>> import skimage as ski
大多数功能都位于子包中,例如
>>> image = ski.data.cat()
您可以使用以下命令列出所有子模块
>>> for m in dir(ski): print(m)
__version__
color
data
draw
exposure
feature
filters
future
graph
io
measure
metrics
morphology
registration
restoration
segmentation
transform
util
大多数 scikit-image 函数都将 NumPy ndarrays 作为参数
>>> camera = ski.data.camera()
>>> camera.dtype
dtype('uint8')
>>> camera.shape
(512, 512)
>>> filtered_camera = ski.filters.gaussian(camera, sigma=1)
>>> type(filtered_camera)
<class 'numpy.ndarray'>
3.3.3. 示例数据
首先,我们需要示例图像来进行操作。该库附带了一些示例图像
>>> image = ski.data.cat()
>>> image.shape
(300, 451, 3)
3.3.4. 输入/输出、数据类型和色彩空间
I/O: skimage.io
将图像保存到磁盘:skimage.io.imsave()
>>> ski.io.imsave("cat.png", image)
从文件读取:skimage.io.imread()
>>> cat = ski.io.imread("cat.png")

这适用于 ImageIO 库支持的许多数据格式。
加载也可以使用 URL
>>> logo = ski.io.imread('https://scikit-image.cn/_static/img/logo.png')
3.3.4.1. 数据类型
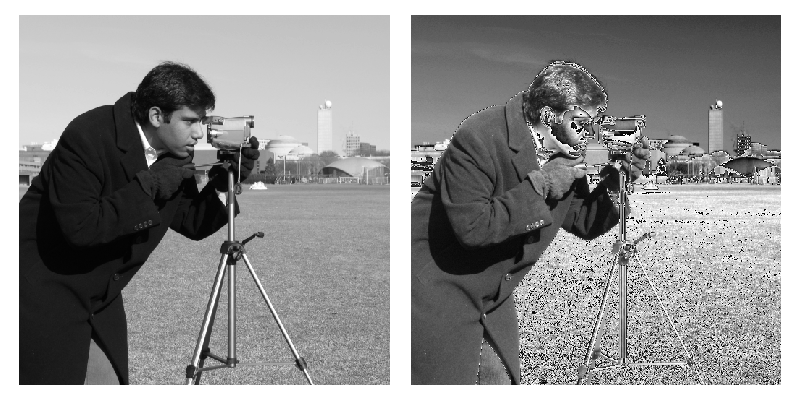
图像 ndarrays 可以用整数(有符号或无符号)或浮点数表示。
注意整数数据类型的溢出
>>> camera = ski.data.camera()
>>> camera.dtype
dtype('uint8')
>>> camera_multiply = 3 * camera
可以有不同的整数大小:8 位、16 位或 32 位,有符号或无符号。
警告
一个重要(如果说有问题的话)的 skimage 约定:浮点图像应位于 [-1, 1] 之间(为了使所有浮点图像具有可比的对比度)
>>> camera_float = ski.util.img_as_float(camera)
>>> camera.max(), camera_float.max()
(np.uint8(255), np.float64(1.0))
一些图像处理例程需要使用浮点数组,因此可能输出具有不同类型和数据范围的数组,与输入数组不同
>>> camera_sobel = ski.filters.sobel(camera)
>>> camera_sobel.max()
np.float64(0.644...)
skimage 中提供了实用函数来转换 dtype 和数据范围,遵循 skimage 的约定:util.img_as_float, util.img_as_ubyte 等。
有关更多详细信息,请参阅 用户指南.
3.3.4.2. 色彩空间
彩色图像的形状为 (N, M, 3) 或 (N, M, 4)(当 alpha 通道编码透明度时)
>>> face = sp.datasets.face()
>>> face.shape
(768, 1024, 3)
skimage.color 中提供了在不同色彩空间(RGB、HSV、LAB 等)之间转换的例程:color.rgb2hsv, color.lab2rgb 等。检查文档字符串以了解输入图像的预期 dtype(和数据范围)。
3.3.5. 图像预处理/增强
目标:降噪、特征(边缘)提取,…
3.3.5.1. 局部滤波器
局部滤波器用相邻像素值的函数替换像素值。该函数可以是线性的或非线性的。
邻域:正方形(选择大小)、圆盘或更复杂的结构元素。

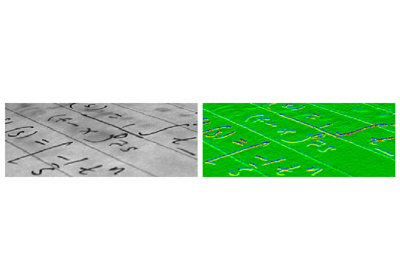
示例:水平 Sobel 滤波器
>>> text = ski.data.text()
>>> hsobel_text = ski.filters.sobel_h(text)
使用以下线性核来计算水平梯度
1   2   1
0   0   0
-1  -2  -1

3.3.5.2. 非局部滤波器
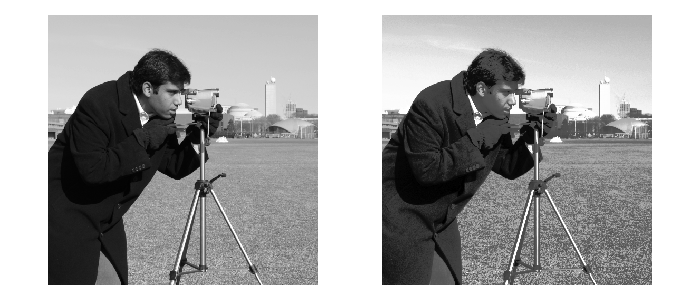
非局部滤波器使用图像的大区域(或整个图像)来变换单个像素的值
>>> camera = ski.data.camera()
>>> camera_equalized = ski.exposure.equalize_hist(camera)
增强几乎均匀的大区域的对比度。
3.3.5.3. 数学形态学
请参阅 维基百科,了解有关数学形态学的介绍。
使用一个简单的形状(一个结构元素)探测图像,并根据该形状在局部上如何拟合或错过图像来修改图像。
默认结构元素:像素的 4 连接
>>> # Import structuring elements to make them more easily accessible
>>> from skimage.morphology import disk, diamond

>>> diamond(1)
array([[0, 1, 0],
       [1, 1, 1],
       [0, 1, 0]], dtype=uint8)
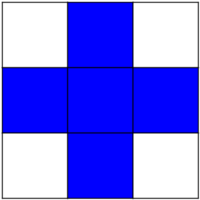
腐蚀 = 最小滤波器。用结构元素覆盖的最小值替换像素的值。
>>> a = np.zeros((7,7), dtype=np.uint8)
>>> a[1:6, 2:5] = 1
>>> a
array([[0, 0, 0, 0, 0, 0, 0],
       [0, 0, 1, 1, 1, 0, 0],
       [0, 0, 1, 1, 1, 0, 0],
       [0, 0, 1, 1, 1, 0, 0],
       [0, 0, 1, 1, 1, 0, 0],
       [0, 0, 1, 1, 1, 0, 0],
       [0, 0, 0, 0, 0, 0, 0]], dtype=uint8)
>>> ski.morphology.binary_erosion(a, diamond(1)).astype(np.uint8)
array([[0, 0, 0, 0, 0, 0, 0],
       [0, 0, 0, 0, 0, 0, 0],
       [0, 0, 0, 1, 0, 0, 0],
       [0, 0, 0, 1, 0, 0, 0],
       [0, 0, 0, 1, 0, 0, 0],
       [0, 0, 0, 0, 0, 0, 0],
       [0, 0, 0, 0, 0, 0, 0]], dtype=uint8)
>>> #Erosion removes objects smaller than the structure
>>> ski.morphology.binary_erosion(a, diamond(2)).astype(np.uint8)
array([[0, 0, 0, 0, 0, 0, 0],
       [0, 0, 0, 0, 0, 0, 0],
       [0, 0, 0, 0, 0, 0, 0],
       [0, 0, 0, 0, 0, 0, 0],
       [0, 0, 0, 0, 0, 0, 0],
       [0, 0, 0, 0, 0, 0, 0],
       [0, 0, 0, 0, 0, 0, 0]], dtype=uint8)
膨胀:最大滤波器
>>> a = np.zeros((5, 5))
>>> a[2, 2] = 1
>>> a
array([[0.,  0.,  0.,  0.,  0.],
       [0.,  0.,  0.,  0.,  0.],
       [0.,  0.,  1.,  0.,  0.],
       [0.,  0.,  0.,  0.,  0.],
       [0.,  0.,  0.,  0.,  0.]])
>>> ski.morphology.binary_dilation(a, diamond(1)).astype(np.uint8)
array([[0, 0, 0, 0, 0],
       [0, 0, 1, 0, 0],
       [0, 1, 1, 1, 0],
       [0, 0, 1, 0, 0],
       [0, 0, 0, 0, 0]], dtype=uint8)
开运算:腐蚀 + 膨胀
>>> a = np.zeros((5,5), dtype=int)
>>> a[1:4, 1:4] = 1; a[4, 4] = 1
>>> a
array([[0, 0, 0, 0, 0],
       [0, 1, 1, 1, 0],
       [0, 1, 1, 1, 0],
       [0, 1, 1, 1, 0],
       [0, 0, 0, 0, 1]])
>>> ski.morphology.binary_opening(a, diamond(1)).astype(np.uint8)
array([[0, 0, 0, 0, 0],
       [0, 0, 1, 0, 0],
       [0, 1, 1, 1, 0],
       [0, 0, 1, 0, 0],
       [0, 0, 0, 0, 0]], dtype=uint8)
开运算会去除小物体并平滑角点。
有更高级的数学形态学可用:顶帽、骨架化等。
另请参阅
基本数学形态学也在 scipy.ndimage.morphology 中实现。 scipy.ndimage 实现适用于任意维度的数组。
3.3.6. 图像分割
图像分割是将不同的标签分配给图像的不同区域,例如为了提取感兴趣对象的像素。
3.3.6.1. 二值分割:前景 + 背景
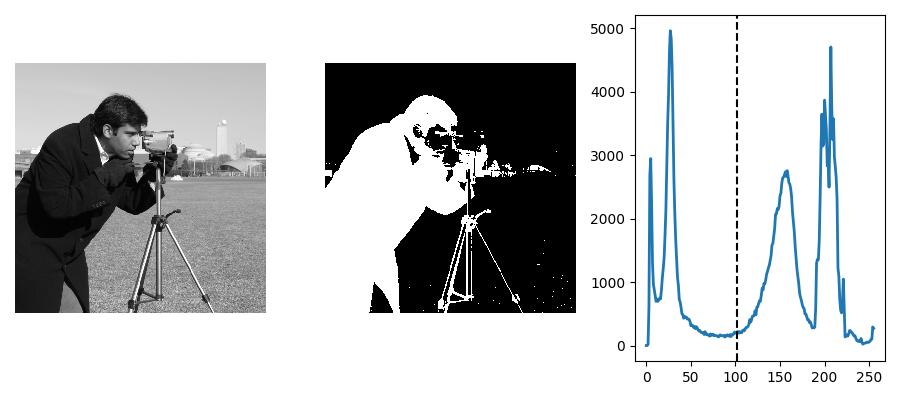
基于直方图的方法:Otsu 阈值法
提示
该 Otsu 方法 是一种简单的启发式方法,用于查找阈值以将前景与背景分离。
camera = ski.data.camera()
val = ski.filters.threshold_otsu(camera)
mask = camera < val
标记离散图像的连通分量
提示
一旦你将前景对象分离出来,就可以用它们彼此分离。为此,我们可以为每个对象分配一个不同的整数标签。
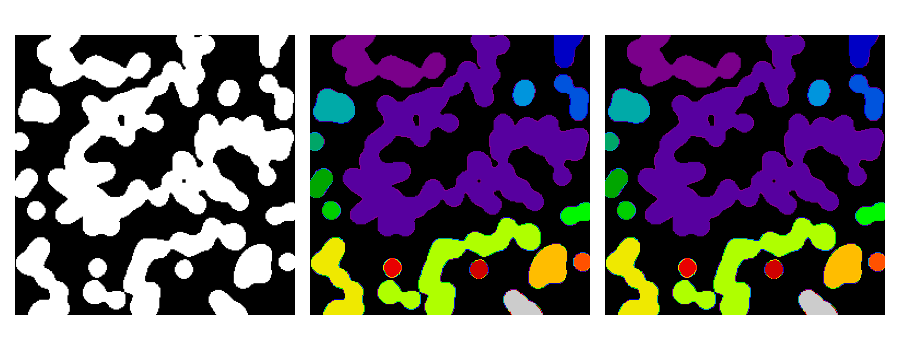
合成数据
>>> n = 20
>>> l = 256
>>> im = np.zeros((l, l))
>>> rng = np.random.default_rng()
>>> points = l * rng.random((2, n ** 2))
>>> im[(points[0]).astype(int), (points[1]).astype(int)] = 1
>>> im = ski.filters.gaussian(im, sigma=l / (4. * n))
>>> blobs = im > im.mean()
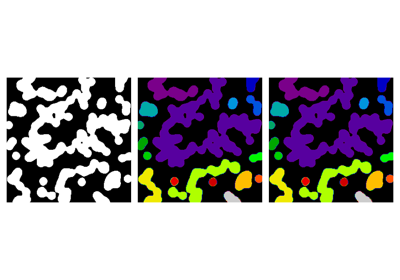
标记所有连通分量
>>> all_labels = ski.measure.label(blobs)
仅标记前景连通分量
>>> blobs_labels = ski.measure.label(blobs, background=0)
另请参阅
scipy.ndimage.find_objects() 用于返回图像中对象的切片。
3.3.6.2. 基于标记的方法
如果你在一组区域内有标记,你可以使用这些标记来分割这些区域。
分水岭 分割
分水岭 (skimage.segmentation.watershed()) 是一种区域增长方法,它会填充图像中的“盆地”。
>>> # Generate an initial image with two overlapping circles
>>> x, y = np.indices((80, 80))
>>> x1, y1, x2, y2 = 28, 28, 44, 52
>>> r1, r2 = 16, 20
>>> mask_circle1 = (x - x1) ** 2 + (y - y1) ** 2 < r1 ** 2
>>> mask_circle2 = (x - x2) ** 2 + (y - y2) ** 2 < r2 ** 2
>>> image = np.logical_or(mask_circle1, mask_circle2)
>>> # Now we want to separate the two objects in image
>>> # Generate the markers as local maxima of the distance
>>> # to the background
>>> import scipy as sp
>>> distance = sp.ndimage.distance_transform_edt(image)
>>> peak_idx = ski.feature.peak_local_max(
...     distance, footprint=np.ones((3, 3)), labels=image
... )
>>> peak_mask = np.zeros_like(distance, dtype=bool)
>>> peak_mask[tuple(peak_idx.T)] = True
>>> markers = ski.morphology.label(peak_mask)
>>> labels_ws = ski.segmentation.watershed(
...     -distance, markers, mask=image
... )
随机游走 分割
随机游走算法 (skimage.segmentation.random_walker()) 与分水岭类似,但采用了一种更“概率”的方法。它基于标签在图像中扩散的概念。
>>> # Transform markers image so that 0-valued pixels are to
>>> # be labelled, and -1-valued pixels represent background
>>> markers[~image] = -1
>>> labels_rw = ski.segmentation.random_walker(image, markers)

3.3.7. 测量区域属性
示例:计算两个分割区域的大小和周长。
>>> properties = ski.measure.regionprops(labels_rw)
>>> [float(prop.area) for prop in properties]
[770.0, 1168.0]
>>> [prop.perimeter for prop in properties]
[np.float64(100.91...), np.float64(126.81...)]
另请参阅
对于某些属性,函数也在 scipy.ndimage.measurements 中以不同的 API 提供(返回一个列表)。
3.3.8. 数据可视化和交互
在测试给定的处理管道时,有意义的可视化很有用。
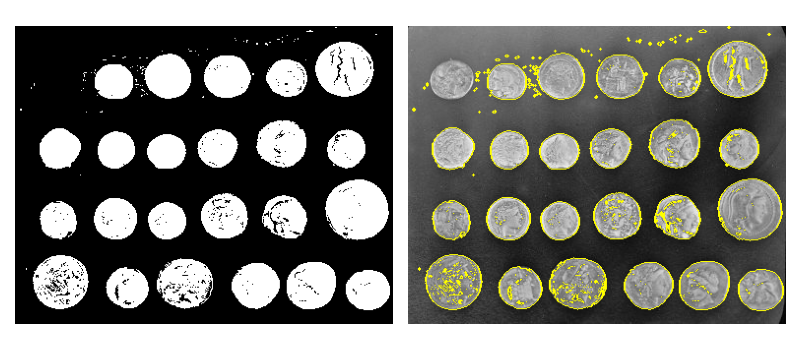
一些图像处理操作
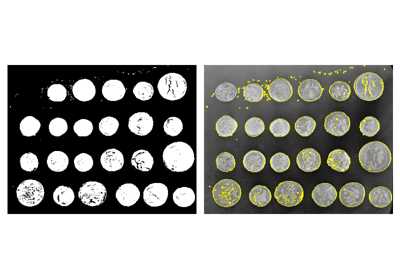
>>> coins = ski.data.coins()
>>> mask = coins > ski.filters.threshold_otsu(coins)
>>> clean_border = ski.segmentation.clear_border(mask)
可视化二进制结果
>>> plt.figure()
<Figure size ... with 0 Axes>
>>> plt.imshow(clean_border, cmap='gray')
<matplotlib.image.AxesImage object at 0x...>
可视化轮廓
>>> plt.figure()
<Figure size ... with 0 Axes>
>>> plt.imshow(coins, cmap='gray')
<matplotlib.image.AxesImage object at 0x...>
>>> plt.contour(clean_border, [0.5])
<matplotlib.contour.QuadContourSet ...>
使用 skimage 专用实用程序函数
>>> coins_edges = ski.segmentation.mark_boundaries(
...     coins, clean_border.astype(int)
... )
3.3.9. 计算机视觉的特征提取
可以从图像中提取几何或纹理描述符,以便
对图像的部分进行分类(例如天空与建筑物)
匹配不同图像的部分(例如用于目标检测)
以及许多其他应用 计算机视觉
示例:使用 Harris 检测器检测角点
tform = ski.transform.AffineTransform(
    scale=(1.3, 1.1), rotation=1, shear=0.7,
    translation=(210, 50)
)
image = ski.transform.warp(
    data.checkerboard(), tform.inverse, output_shape=(350, 350)
)

coords = ski.feature.corner_peaks(
    ski.feature.corner_harris(image), min_distance=5
)
coords_subpix = ski.feature.corner_subpix(
    image, coords, window_size=13
)
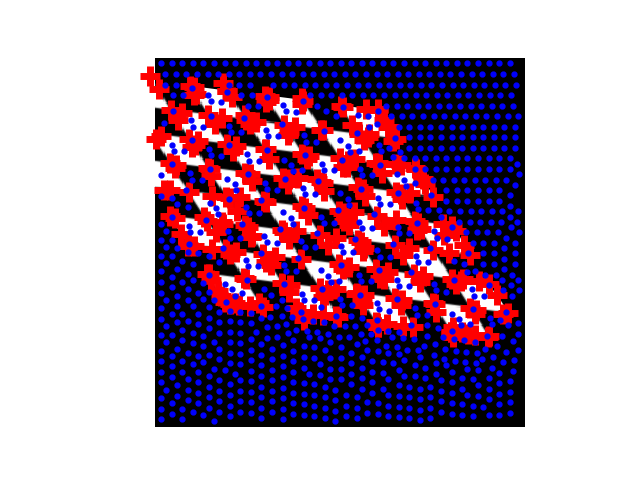
(此示例取自 scikit-image 中的 plot_corner 示例)
然后可以使用兴趣点(如角点)在不同的图像中匹配物体,如 scikit-image 的 plot_matching 示例中所述。


