注意
转到结尾 下载完整的示例代码。
3.3.11.9. 图像连通分量的标记
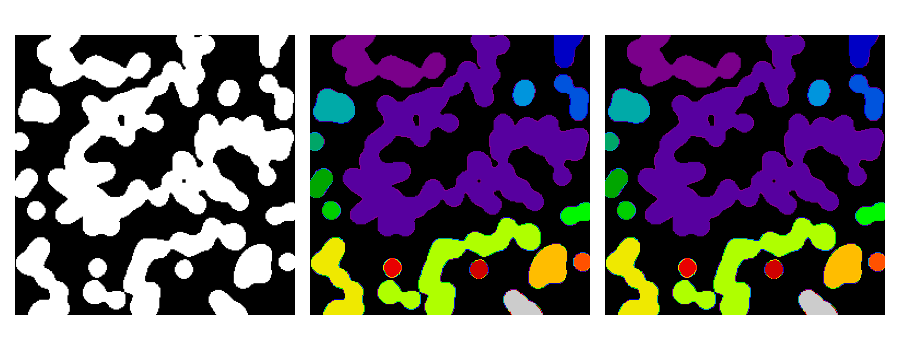
此示例演示了如何使用专用的 skimage.measure.label 函数标记二值图像的连通分量。

from skimage import measure
from skimage import filters
import matplotlib.pyplot as plt
import numpy as np

n = 12
l = 256
rng = np.random.default_rng(27446968)
im = np.zeros((l, l))
points = l * rng.random((2, n**2))
im[(points[0]).astype(int), (points[1]).astype(int)] = 1
im = filters.gaussian(im, sigma=l / (4.0 * n))
blobs = im > 0.7 * im.mean()

all_labels = measure.label(blobs)
blobs_labels = measure.label(blobs, background=0)

plt.figure(figsize=(9, 3.5))
plt.subplot(131)
plt.imshow(blobs, cmap="gray")
plt.axis("off")
plt.subplot(132)
plt.imshow(all_labels, cmap="nipy_spectral")
plt.axis("off")
plt.subplot(133)
plt.imshow(blobs_labels, cmap="nipy_spectral")
plt.axis("off")

plt.tight_layout()
plt.show()
脚本总运行时间:(0 分钟 0.074 秒)