1.3.5. 一些练习
1.3.5.1. 数组操作
构建二维数组(无需显式输入)
[[1,  6, 11],
 [2,  7, 12],
 [3,  8, 13],
 [4,  9, 14],
 [5, 10, 15]]
并生成一个包含其第二行和第四行的数组。
将数组的每一列
>>> import numpy as np
>>> a = np.arange(25).reshape(5, 5)
按元素除以数组
b = np.array([1., 5, 10, 15, 20])。(提示:np.newaxis)。较难的:生成一个 10 x 3 的随机数数组(范围为 [0,1])。对于每一行,选择最接近 0.5 的数字。
使用
abs和argmin找到每行的最接近的列j。使用花式索引提取数字。(提示:
a[i,j]– 数组i必须包含对应于j中内容的行号。)
1.3.5.2. 图片操作:给脸部加相框
让我们从浣熊的图像开始,对 NumPy 数组进行一些操作。 scipy 使用 scipy.datasets.face 函数提供了此图像的二维数组
>>> import scipy as sp
>>> face = sp.datasets.face(gray=True)  # 2D grayscale image
以下是一些我们可以通过操作获得的图像:使用不同的颜色映射,裁剪图像,改变图像的某些部分。

让我们使用 matplotlib 的 imshow 函数显示图像。
>>> import matplotlib.pyplot as plt
>>> face = sp.datasets.face(gray=True)
>>> plt.imshow(face)
<matplotlib.image.AxesImage object at 0x...>
- 人脸以伪彩色显示。必须指定颜色映射才能以灰色显示。
创建一个图像的数组,中心更窄,例如,
>>> plt.imshow(face, cmap=plt.cm.gray)
<matplotlib.image.AxesImage object at 0x...>
- 从图像的所有边界移除 100 像素。要检查结果,使用
imshow显示这个新数组。 现在,我们将用黑色挂坠给脸部加相框。为此,我们
>>> crop_face = face[100:-100, 100:-100]
- 从图像的所有边界移除 100 像素。要检查结果,使用
- 需要创建一个对应于我们要设置为黑色的像素的掩码。人脸的中心大约在 (660, 330) 处,因此我们通过以下条件定义了掩码:
(y-300)**2 + (x-660)**2 然后,我们将值 0 分配给对应于掩码的图像像素。语法非常简单直观
>>> sy, sx = face.shape
>>> y, x = np.ogrid[0:sy, 0:sx] # x and y indices of pixels
>>> y.shape, x.shape
((768, 1), (1, 1024))
>>> centerx, centery = (660, 300) # center of the image
>>> mask = ((y - centery)**2 + (x - centerx)**2) > 230**2 # circle
后续:将此练习的所有说明复制到名为
>>> face[mask] = 0
>>> plt.imshow(face)
<matplotlib.image.AxesImage object at 0x...>
- 需要创建一个对应于我们要设置为黑色的像素的掩码。人脸的中心大约在 (660, 330) 处,因此我们通过以下条件定义了掩码:
face_locket.py的脚本中,然后在 IPython 中使用%run face_locket.py执行此脚本。将圆形更改为椭圆形。
1.3.5.3. 数据统计
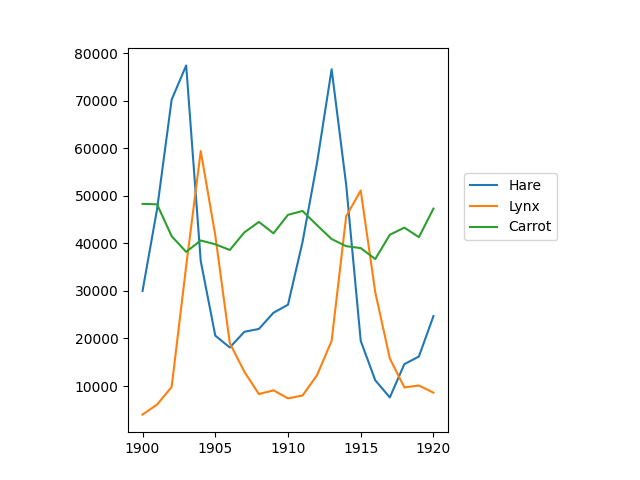
populations.txt 中的数据描述了加拿大北部 20 年间野兔和猞猁(以及胡萝卜)的数量
根据 populations.txt 中的数据,计算并打印…
>>> data = np.loadtxt('data/populations.txt')
>>> year, hares, lynxes, carrots = data.T  # trick: columns to variables

>>> import matplotlib.pyplot as plt
>>> plt.axes([0.2, 0.1, 0.5, 0.8])
<Axes: >
>>> plt.plot(year, hares, year, lynxes, year, carrots)
[<matplotlib.lines.Line2D object at ...>, ...]
>>> plt.legend(('Hare', 'Lynx', 'Carrot'), loc=(1.05, 0.5))
<matplotlib.legend.Legend object at ...>

每个物种在该时期的年份中的平均数量和标准差。
每个物种数量最多的年份。
每年数量最多的物种。(提示:
argsort和np.array(['H', 'L', 'C'])的花式索引)任何一个物种的数量超过 50000 的年份。(提示:比较和
np.any)每个物种数量最少的 2 个年份。(提示:
argsort,花式索引)比较(绘制)野兔数量变化(见
help(np.gradient))和猞猁数量。检查相关性(见help(np.corrcoef))。… 所有这些都不用 for 循环。
解决方案: Python 源 文件
1.3.5.4. 粗略积分近似
编写一个函数 f(a, b, c),它返回  。在参数范围
 [0,1] x [0,1] x [0,1] 内,构建一个 24x12x6 数组,其中包含其值。
用平均值近似该体积上的三维积分
在该体积上的三维积分

精确结果为:  – 您的相对误差是多少?
(提示:使用按元素操作和广播。您可以使用 np.ogrid 在给定范围内生成一定数量的点,例如使用 np.ogrid[0:1:20j]。)
提醒 Python 函数
def f(a, b, c):
    return some_result
解决方案: Python 源 文件
1.3.5.5. 曼德博集合

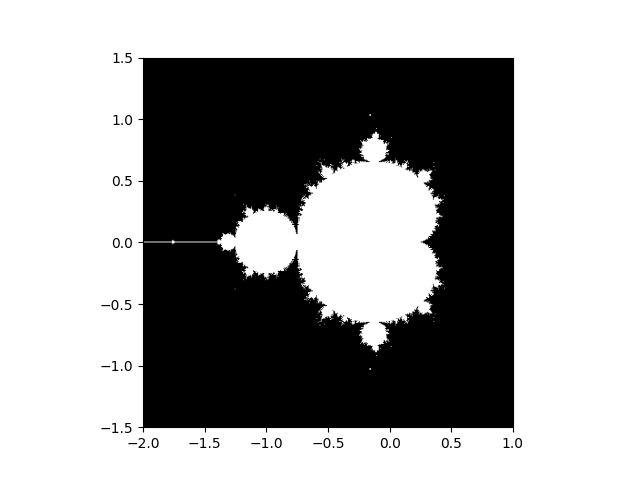
编写一个脚本,用于计算曼德博分形。曼德博迭代
N_max = 50
some_threshold = 50

c = x + 1j*y

z = 0
for j in range(N_max):
    z = z**2 + c
如果  <
< some_threshold,则点 (x, y) 属于曼德博集合。
通过以下方式进行计算
在范围 [-2, 1] x [-1.5, 1.5] 内构造 c = x + 1j*y 值的网格
执行迭代
形成二维布尔掩码,指示哪些点在集合中
使用以下方式将结果保存到图像中
>>> import matplotlib.pyplot as plt
>>> plt.imshow(mask.T, extent=[-2, 1, -1.5, 1.5])
<matplotlib.image.AxesImage object at ...>
>>> plt.gray()
>>> plt.savefig('mandelbrot.png')
解决方案: Python 源 文件
1.3.5.6. 马尔可夫链

马尔可夫链转移矩阵 P 和状态上的概率分布 p
0 <= P[i,j] <= 1:从状态i转移到状态j的概率转移规则:

all(sum(P, axis=1) == 1),p.sum() == 1:归一化
编写一个使用 5 个状态的脚本,并
构建一个随机矩阵,并对每一行进行归一化,使其成为一个转移矩阵。
从一个随机的(归一化的)概率分布
p开始,并进行 50 步 =>p_50计算稳态分布:
P.T的特征向量,其特征值为 1(数值上:最接近 1) =>p_stationary
请记住对特征向量进行归一化 — 我没有…
检查
p_50和p_stationary是否等于容差 1e-5
工具箱:np.random,@,np.linalg.eig,约简,abs(),argmin,比较,all,np.linalg.norm 等。
解决方案: Python 源 文件