注意
转到末尾 下载完整示例代码。
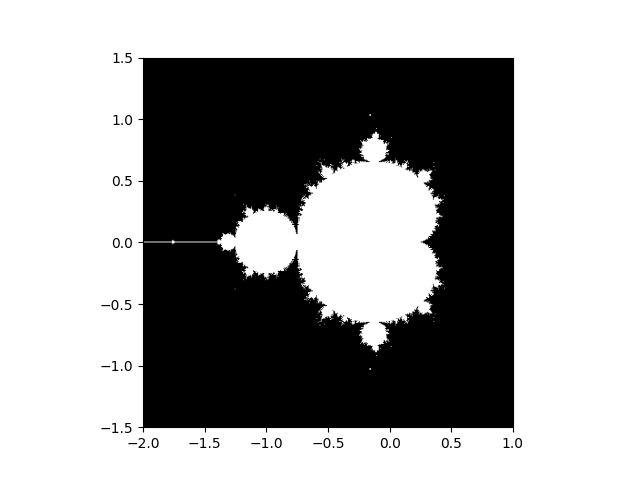
曼德博集合
计算曼德博分形并将其绘制出来
import numpy as np
import matplotlib.pyplot as plt
from numpy import newaxis
import warnings


def compute_mandelbrot(N_max, some_threshold, nx, ny):
    # A grid of c-values
    x = np.linspace(-2, 1, nx)
    y = np.linspace(-1.5, 1.5, ny)

    c = x[:, newaxis] + 1j * y[newaxis, :]

    # Mandelbrot iteration

    z = c

    # The code below overflows in many regions of the x-y grid, suppress
    # warnings temporarily
    with warnings.catch_warnings():
        warnings.simplefilter("ignore")
        for j in range(N_max):
            z = z**2 + c
        mandelbrot_set = abs(z) < some_threshold

    return mandelbrot_set


mandelbrot_set = compute_mandelbrot(50, 50.0, 601, 401)

plt.imshow(mandelbrot_set.T, extent=(-2, 1, -1.5, 1.5))
plt.gray()
plt.show()
脚本总运行时间:(0 分钟 0.076 秒)