注意
转到末尾 下载完整的示例代码。
3.4.8.10. 绘制 9 次多项式拟合图
使用 4 次和 9 次多项式模型拟合从 9 次多项式生成的数 据,以证明通常更简单的模型更可取。
import numpy as np
import matplotlib.pyplot as plt
from matplotlib.colors import ListedColormap

from sklearn import linear_model

# Create color maps for 3-class classification problem, as with iris
cmap_light = ListedColormap(["#FFAAAA", "#AAFFAA", "#AAAAFF"])
cmap_bold = ListedColormap(["#FF0000", "#00FF00", "#0000FF"])


rng = np.random.default_rng(27446968)
x = 2 * rng.random(100) - 1

f = lambda t: 1.2 * t**2 + 0.1 * t**3 - 0.4 * t**5 - 0.5 * t**9
y = f(x) + 0.4 * rng.normal(size=100)

x_test = np.linspace(-1, 1, 100)
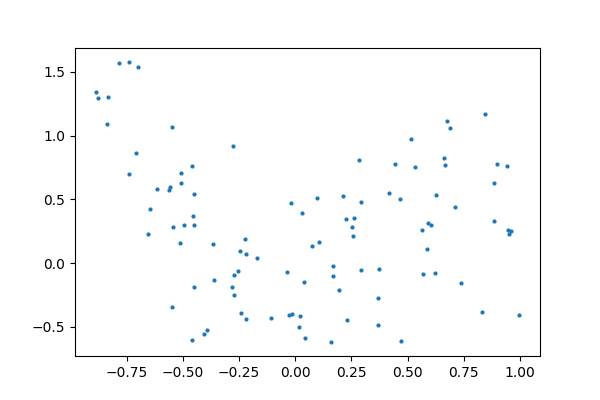
数据
plt.figure(figsize=(6, 4))
plt.scatter(x, y, s=4)
<matplotlib.collections.PathCollection object at 0x7f78e6aee930>
拟合 4 次和 9 次多项式
为此,我们需要设计特征:x 的 n 次幂
plt.figure(figsize=(6, 4))
plt.scatter(x, y, s=4)

X = np.array([x**i for i in range(5)]).T
X_test = np.array([x_test**i for i in range(5)]).T
regr = linear_model.LinearRegression()
regr.fit(X, y)
plt.plot(x_test, regr.predict(X_test), label="4th order")

X = np.array([x**i for i in range(10)]).T
X_test = np.array([x_test**i for i in range(10)]).T
regr = linear_model.LinearRegression()
regr.fit(X, y)
plt.plot(x_test, regr.predict(X_test), label="9th order")

plt.legend(loc="best")
plt.axis("tight")
plt.title("Fitting a 4th and a 9th order polynomial")
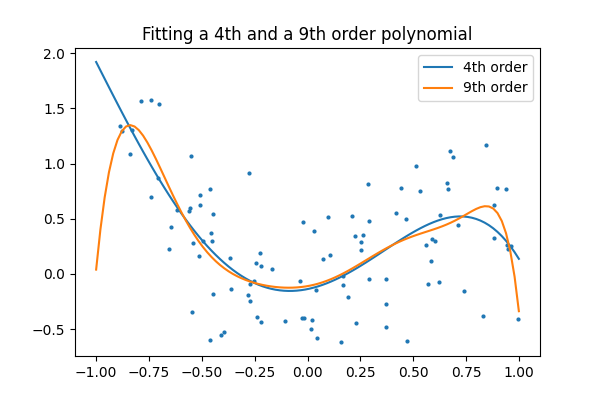
Text(0.5, 1.0, 'Fitting a 4th and a 9th order polynomial')
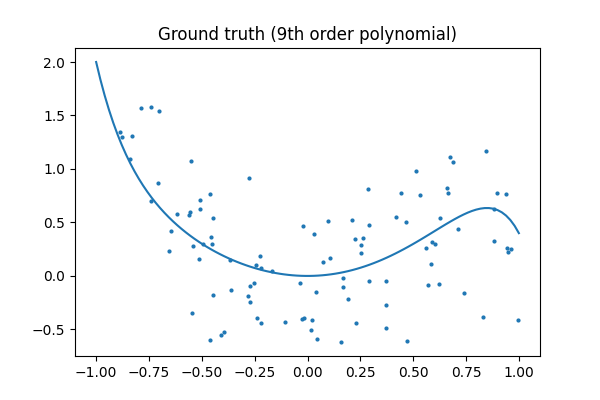
真实值
plt.figure(figsize=(6, 4))
plt.scatter(x, y, s=4)
plt.plot(x_test, f(x_test), label="truth")
plt.axis("tight")
plt.title("Ground truth (9th order polynomial)")

plt.show()
脚本总运行时间:(0 分钟 0.170 秒)