注意
转到末尾 下载完整的示例代码。
3.4.8.2. 测量决策树性能
演示在训练集上测试时过度拟合。
获取数据
from sklearn.datasets import fetch_california_housing

data = fetch_california_housing(as_frame=True)
训练和测试模型
from sklearn.tree import DecisionTreeRegressor

clf = DecisionTreeRegressor().fit(data.data, data.target)

predicted = clf.predict(data.data)
expected = data.target
绘制预测值与预期值的函数关系图
import matplotlib.pyplot as plt

plt.figure(figsize=(4, 3))
plt.scatter(expected, predicted)
plt.plot([0, 5], [0, 5], "--k")
plt.axis("tight")
plt.xlabel("True price ($100k)")
plt.ylabel("Predicted price ($100k)")
plt.tight_layout()
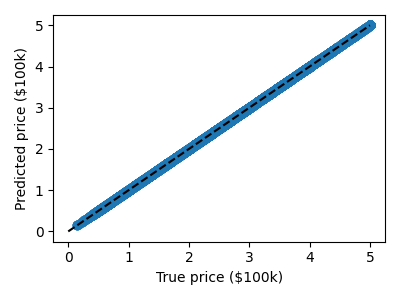
几乎没有错误!
这太好了,不像是真的:我们正在使用训练数据测试模型,这不是泛化能力的衡量标准。
结果无效
脚本总运行时间:(0 分钟 1.467 秒)