注意
转到末尾 下载完整的示例代码。
2.6.8.2. 图像插值
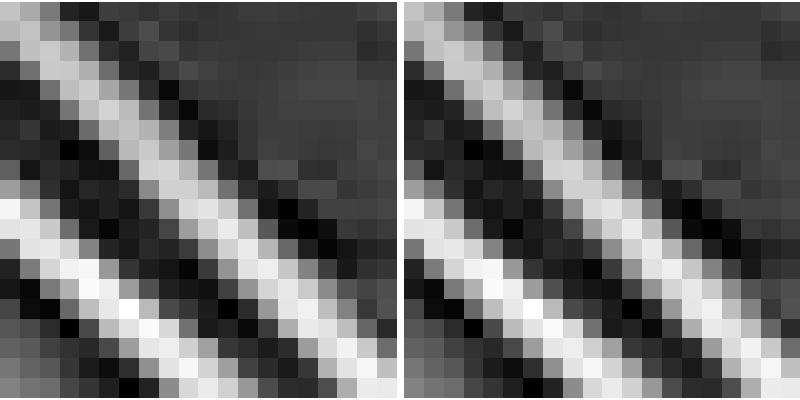
此示例演示了浣熊脸部的图像插值。

import scipy as sp
import matplotlib.pyplot as plt

f = sp.datasets.face(gray=True)

plt.figure(figsize=(8, 4))

plt.subplot(1, 2, 1)
plt.imshow(f[320:340, 510:530], cmap="gray")
plt.axis("off")

plt.subplot(1, 2, 2)
plt.imshow(f[320:340, 510:530], cmap="gray", interpolation="nearest")
plt.axis("off")

plt.subplots_adjust(wspace=0.02, hspace=0.02, top=1, bottom=0, left=0, right=1)
plt.show()
脚本总运行时间:(0 分钟 0.159 秒)