注意
转到末尾 下载完整的示例代码。
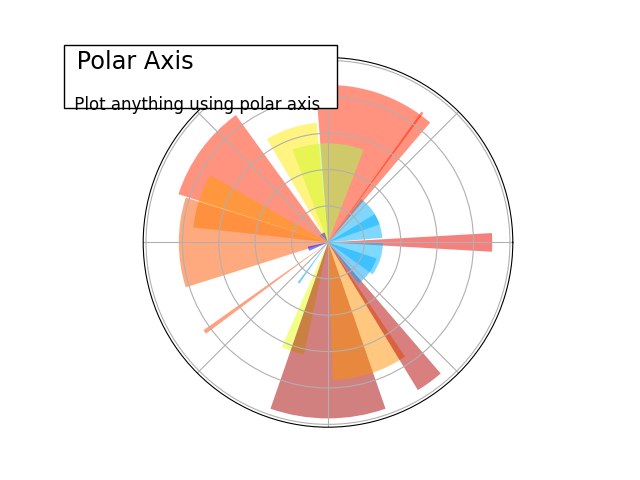
极坐标绘图,带装饰
一个展示如何在极坐标系中绘图以及一些装饰的示例。

import numpy as np

import matplotlib
import matplotlib.pyplot as plt


plt.subplot(1, 1, 1, polar=True)

N = 20
theta = np.arange(0.0, 2 * np.pi, 2 * np.pi / N)
rng = np.random.default_rng()
radii = 10 * rng.random(N)
width = np.pi / 4 * rng.random(N)
bars = plt.bar(theta, radii, width=width, bottom=0.0)
jet = matplotlib.colormaps["jet"]

for r, bar in zip(radii, bars, strict=True):
    bar.set_facecolor(jet(r / 10.0))
    bar.set_alpha(0.5)
plt.gca().set_xticklabels([])
plt.gca().set_yticklabels([])


plt.text(
    -0.2,
    1.02,
    " Polar Axis                  \n",
    horizontalalignment="left",
    verticalalignment="top",
    size="xx-large",
    bbox={"facecolor": "white", "alpha": 1.0},
    transform=plt.gca().transAxes,
)

plt.text(
    -0.2,
    1.01,
    "\n\n Plot anything using polar axis ",
    horizontalalignment="left",
    verticalalignment="top",
    size="large",
    transform=plt.gca().transAxes,
)

plt.show()
脚本总运行时间:(0 分钟 0.111 秒)