注意
转到末尾 下载完整示例代码。
子图网格
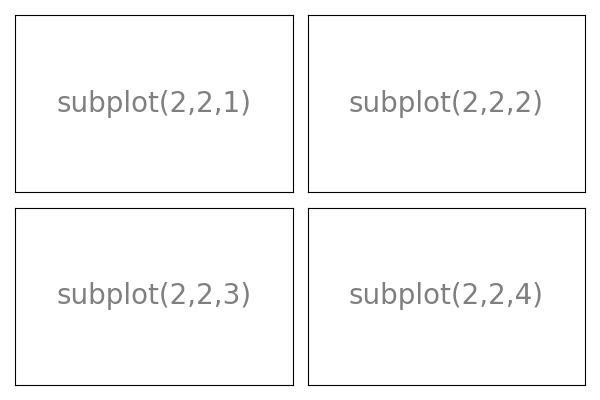
一个展示 matplotlib 中子图网格的例子。

import matplotlib.pyplot as plt

plt.figure(figsize=(6, 4))
plt.subplot(2, 2, 1)
plt.xticks([])
plt.yticks([])
plt.text(0.5, 0.5, "subplot(2,2,1)", ha="center", va="center", size=20, alpha=0.5)

plt.subplot(2, 2, 2)
plt.xticks([])
plt.yticks([])
plt.text(0.5, 0.5, "subplot(2,2,2)", ha="center", va="center", size=20, alpha=0.5)

plt.subplot(2, 2, 3)
plt.xticks([])
plt.yticks([])

plt.text(0.5, 0.5, "subplot(2,2,3)", ha="center", va="center", size=20, alpha=0.5)

plt.subplot(2, 2, 4)
plt.xticks([])
plt.yticks([])
plt.text(0.5, 0.5, "subplot(2,2,4)", ha="center", va="center", size=20, alpha=0.5)

plt.tight_layout()
plt.show()
脚本总运行时间:(0 分钟 0.072 秒)