注意
转到结尾 下载完整的示例代码。
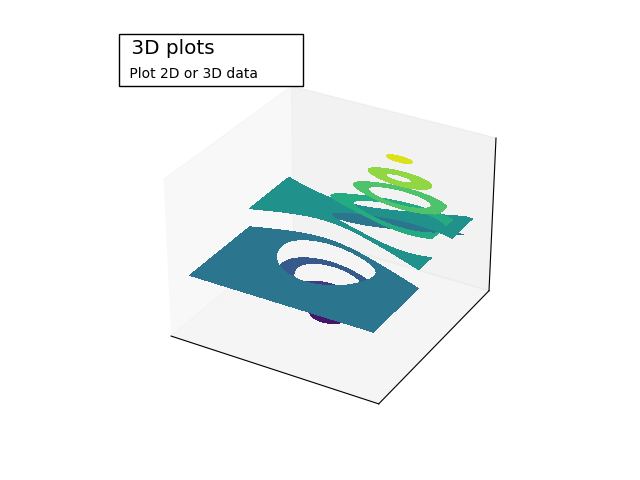
3D 绘图
演示使用 matplotlib 进行 3D 绘图并设置图形样式。

import matplotlib.pyplot as plt
from mpl_toolkits.mplot3d.axes3d import Axes3D, get_test_data

ax: Axes3D = plt.figure().add_subplot(projection="3d")
X, Y, Z = get_test_data(0.05)
cset = ax.contourf(X, Y, Z)
ax.clabel(cset, fontsize=9, inline=1)

plt.xticks([])
plt.yticks([])
ax.set_zticks([])


ax.text2D(
    -0.05,
    1.05,
    " 3D plots             \n",
    horizontalalignment="left",
    verticalalignment="top",
    bbox={"facecolor": "white", "alpha": 1.0},
    family="DejaVu Sans",
    size="x-large",
    transform=plt.gca().transAxes,
)

ax.text2D(
    -0.05,
    0.975,
    " Plot 2D or 3D data",
    horizontalalignment="left",
    verticalalignment="top",
    family="DejaVu Sans",
    size="medium",
    transform=plt.gca().transAxes,
)

plt.show()
脚本总运行时间:(0 分 0.053 秒)