注意
转到结尾 下载完整的示例代码。
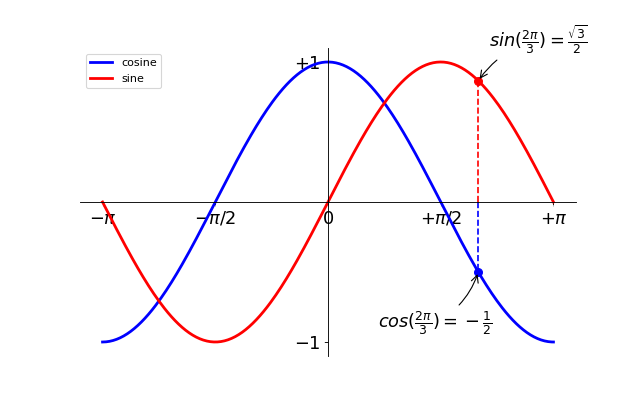
练习
使用 matplotlib 的练习。

import numpy as np
import matplotlib.pyplot as plt

plt.figure(figsize=(8, 5), dpi=80)
plt.subplot(111)

X = np.linspace(-np.pi, np.pi, 256)
C, S = np.cos(X), np.sin(X)

plt.plot(X, C, color="blue", linewidth=2.5, linestyle="-", label="cosine")
plt.plot(X, S, color="red", linewidth=2.5, linestyle="-", label="sine")

ax = plt.gca()
ax.spines["right"].set_color("none")
ax.spines["top"].set_color("none")
ax.xaxis.set_ticks_position("bottom")
ax.spines["bottom"].set_position(("data", 0))
ax.yaxis.set_ticks_position("left")
ax.spines["left"].set_position(("data", 0))

plt.xlim(X.min() * 1.1, X.max() * 1.1)
plt.xticks(
    [-np.pi, -np.pi / 2, 0, np.pi / 2, np.pi],
    [r"$-\pi$", r"$-\pi/2$", r"$0$", r"$+\pi/2$", r"$+\pi$"],
)

plt.ylim(C.min() * 1.1, C.max() * 1.1)
plt.yticks([-1, 1], [r"$-1$", r"$+1$"])

plt.legend(loc="upper left")

t = 2 * np.pi / 3
plt.plot([t, t], [0, np.cos(t)], color="blue", linewidth=1.5, linestyle="--")
plt.scatter(
    [
        t,
    ],
    [
        np.cos(t),
    ],
    50,
    color="blue",
)
plt.annotate(
    r"$sin(\frac{2\pi}{3})=\frac{\sqrt{3}}{2}$",
    xy=(t, np.sin(t)),
    xycoords="data",
    xytext=(10, 30),
    textcoords="offset points",
    fontsize=16,
    arrowprops={"arrowstyle": "->", "connectionstyle": "arc3,rad=.2"},
)

plt.plot([t, t], [0, np.sin(t)], color="red", linewidth=1.5, linestyle="--")
plt.scatter(
    [
        t,
    ],
    [
        np.sin(t),
    ],
    50,
    color="red",
)
plt.annotate(
    r"$cos(\frac{2\pi}{3})=-\frac{1}{2}$",
    xy=(t, np.cos(t)),
    xycoords="data",
    xytext=(-90, -50),
    textcoords="offset points",
    fontsize=16,
    arrowprops={"arrowstyle": "->", "connectionstyle": "arc3,rad=.2"},
)

for label in ax.get_xticklabels() + ax.get_yticklabels():
    label.set_fontsize(16)
    label.set_bbox({"facecolor": "white", "edgecolor": "None", "alpha": 0.65})

plt.show()
脚本总运行时间:(0 分钟 0.100 秒)