注意
转到结尾 下载完整的示例代码。
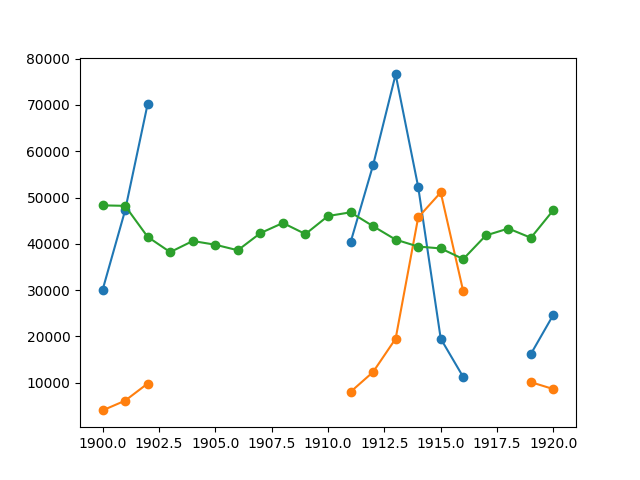
示例:掩码统计
绘制掩码统计
import numpy as np
import matplotlib.pyplot as plt

data = np.loadtxt("../../../../data/populations.txt")
populations = np.ma.masked_array(data[:, 1:])  # type: ignore[var-annotated]
year = data[:, 0]

bad_years = ((year >= 1903) & (year <= 1910)) | ((year >= 1917) & (year <= 1918))
populations[bad_years, 0] = np.ma.masked
populations[bad_years, 1] = np.ma.masked

plt.plot(year, populations, "o-")
plt.show()
脚本的总运行时间:(0 分钟 0.061 秒)